We want to hear from you! Please let us know what data you’d like to see in future reports. Email your thoughts to us at info@iso.io!
Introducing the ISO Service Index Benchmark Report
During the pandemic, the freight market experienced significant demand and enjoyed high rates. However, the market began to shift after the pandemic eased as consumer spending patterns shifted, inventory levels increased, and economic uncertainties grew. By late 2022 and into 2023, many carriers and brokers reported declining freight volumes and lower rates, which ushered in the freight recession. This shift was further exacerbated by factors such as inflation, rising interest rates, and broader economic slowdowns, which collectively contributed to the challenging conditions in the freight market.
The freight recession is now in its second year. While the market continues to face lower demand and rates than during the pandemic, some green shoots are appearing. However, logistics service providers should not focus just on rates but instead on optimizing service performance to differentiate themselves and grow in an increasingly challenging market.
Shippers and logistics service providers can utilize Isometric Technologies’ (ISO) service index to compare transportation performance to industry benchmarks. The index offers dozens of standardized performance KPI benchmarks and the “ISO Score,” a weighted composite of on-time delivery, on-time pickup, and tender acceptance/bounce rates. An ISO score is intended to be a “FICO” score for freight and is a composite measure of service, 0-100, factoring in weighted On-Time Pickup, On-Time Delivery, and either Tender Acceptance (Shipper Service Index) or Bounce Rate (Broker Service Index).
For our first-ever look inside the ISO Service Index, we break out data from the first half of 2024, focusing on service levels and performance metrics for both our Shipper and Broker networks. The report highlights how service quality is critical for brokers and carriers to maintain strong relationships with enterprise shippers, especially in a challenging market.
Inside the Data: Key Insights from the First Half of 2024
Data from the first half of the year shows just how many ways carrier selection impacts service performance.
Key insights include:
- Carriers with more volume delivered the best performance
- Fleet size will impact service
- Carrier utilization matters
- Rates were correlated to service regionally
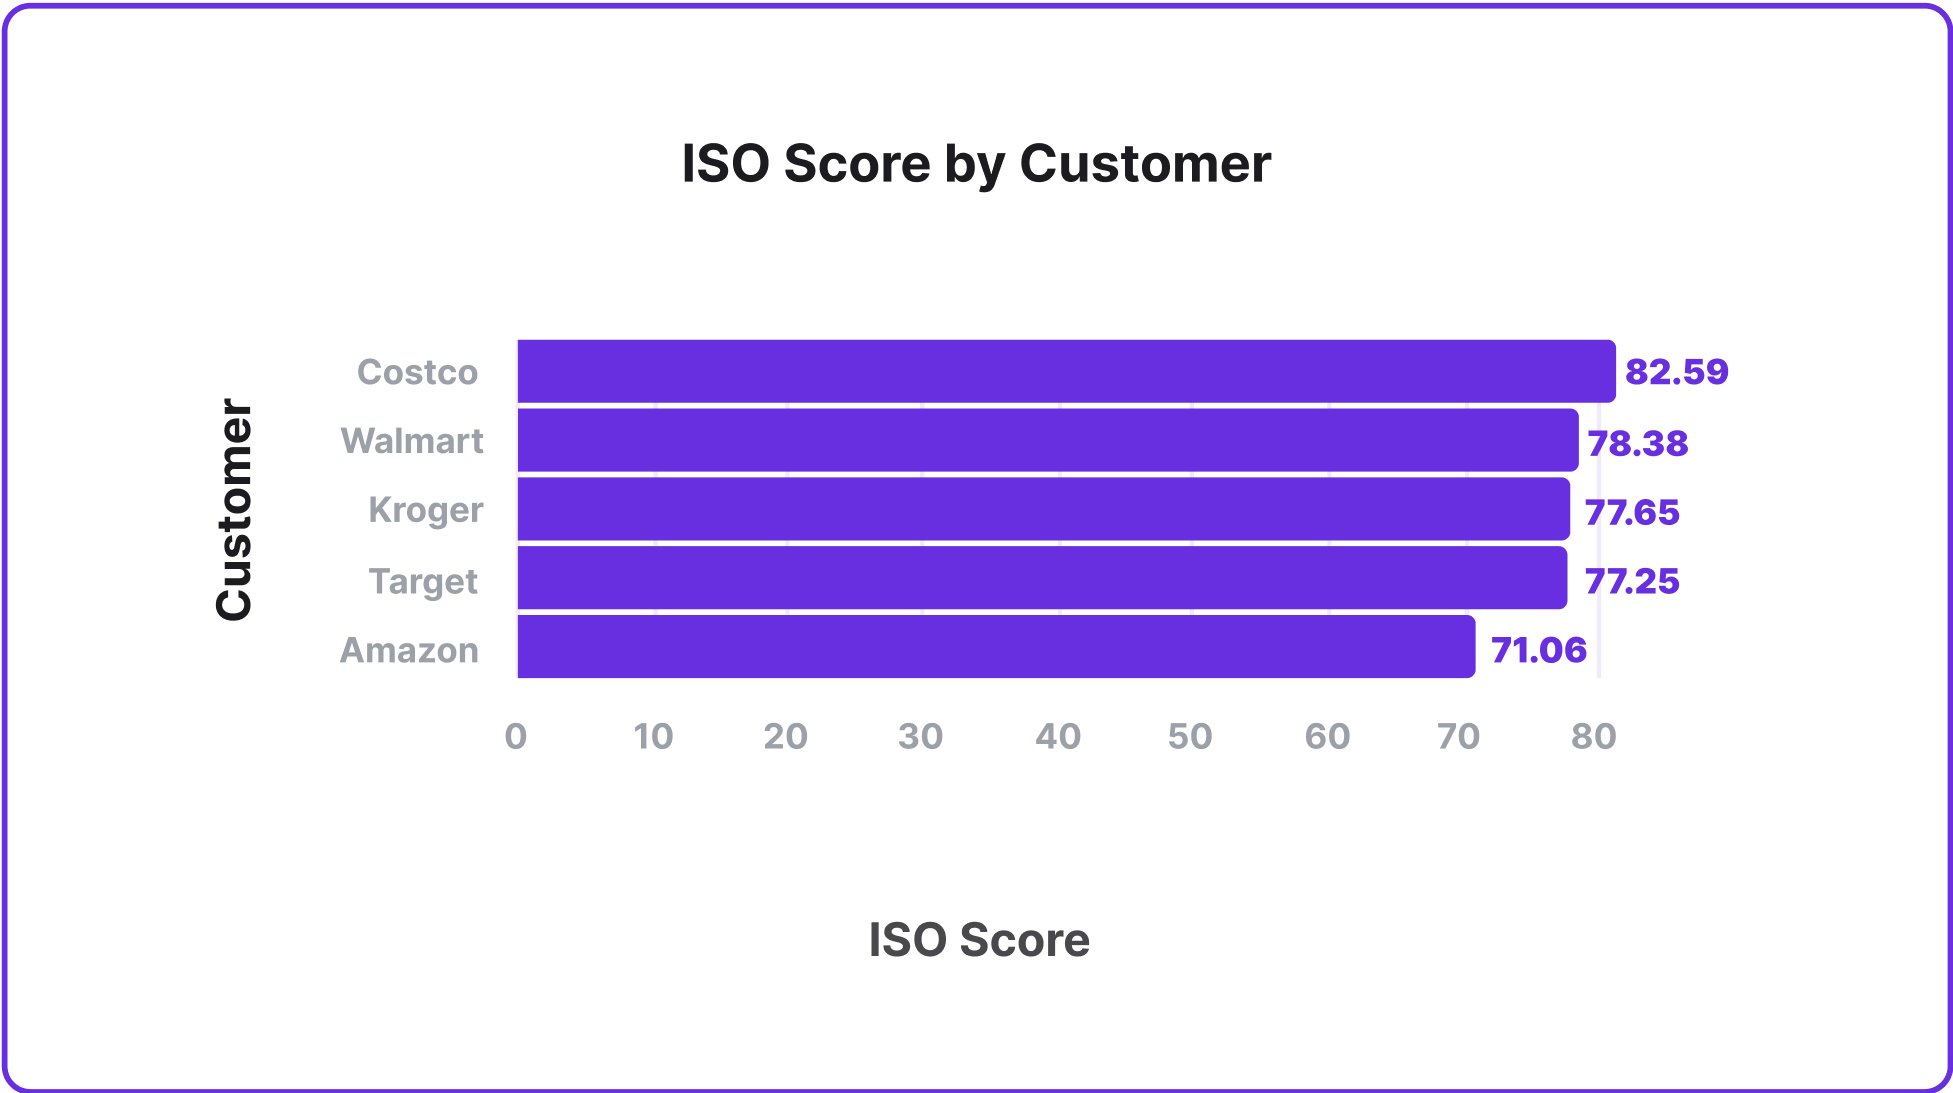
Carriers With Better Service Earned More Volume
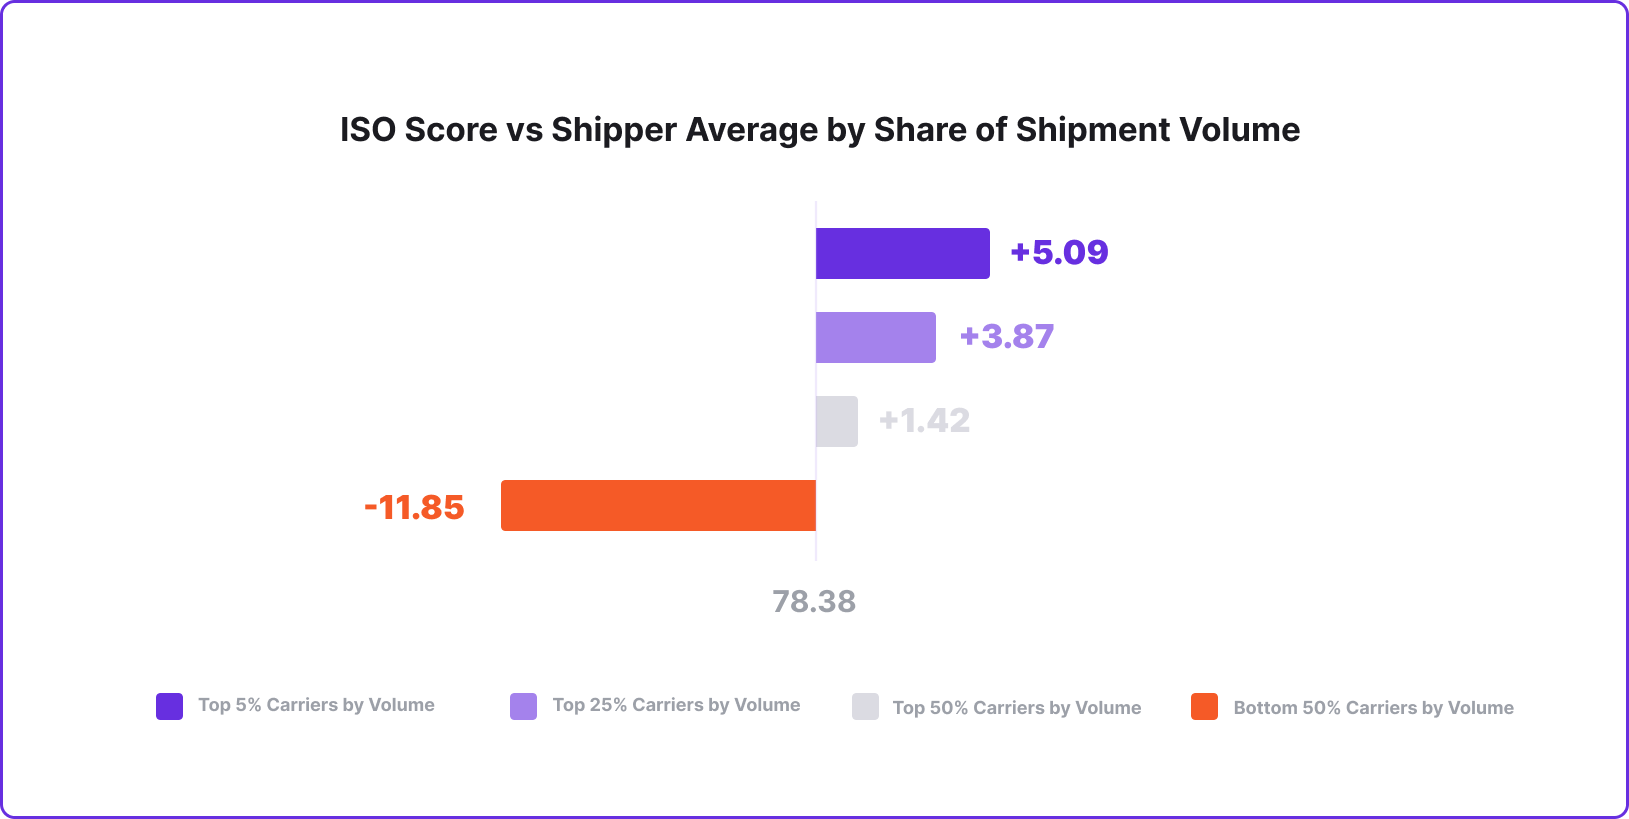
Data from Shipper Service Index Benchmarks
Carriers in the top 5% of shippers’ networks by volume outperformed everyone else. Top carriers had 17% better service scores on average than those in the bottom 50%, underscoring the importance for carriers to prioritize service level performance to get more traction with enterprise shippers.
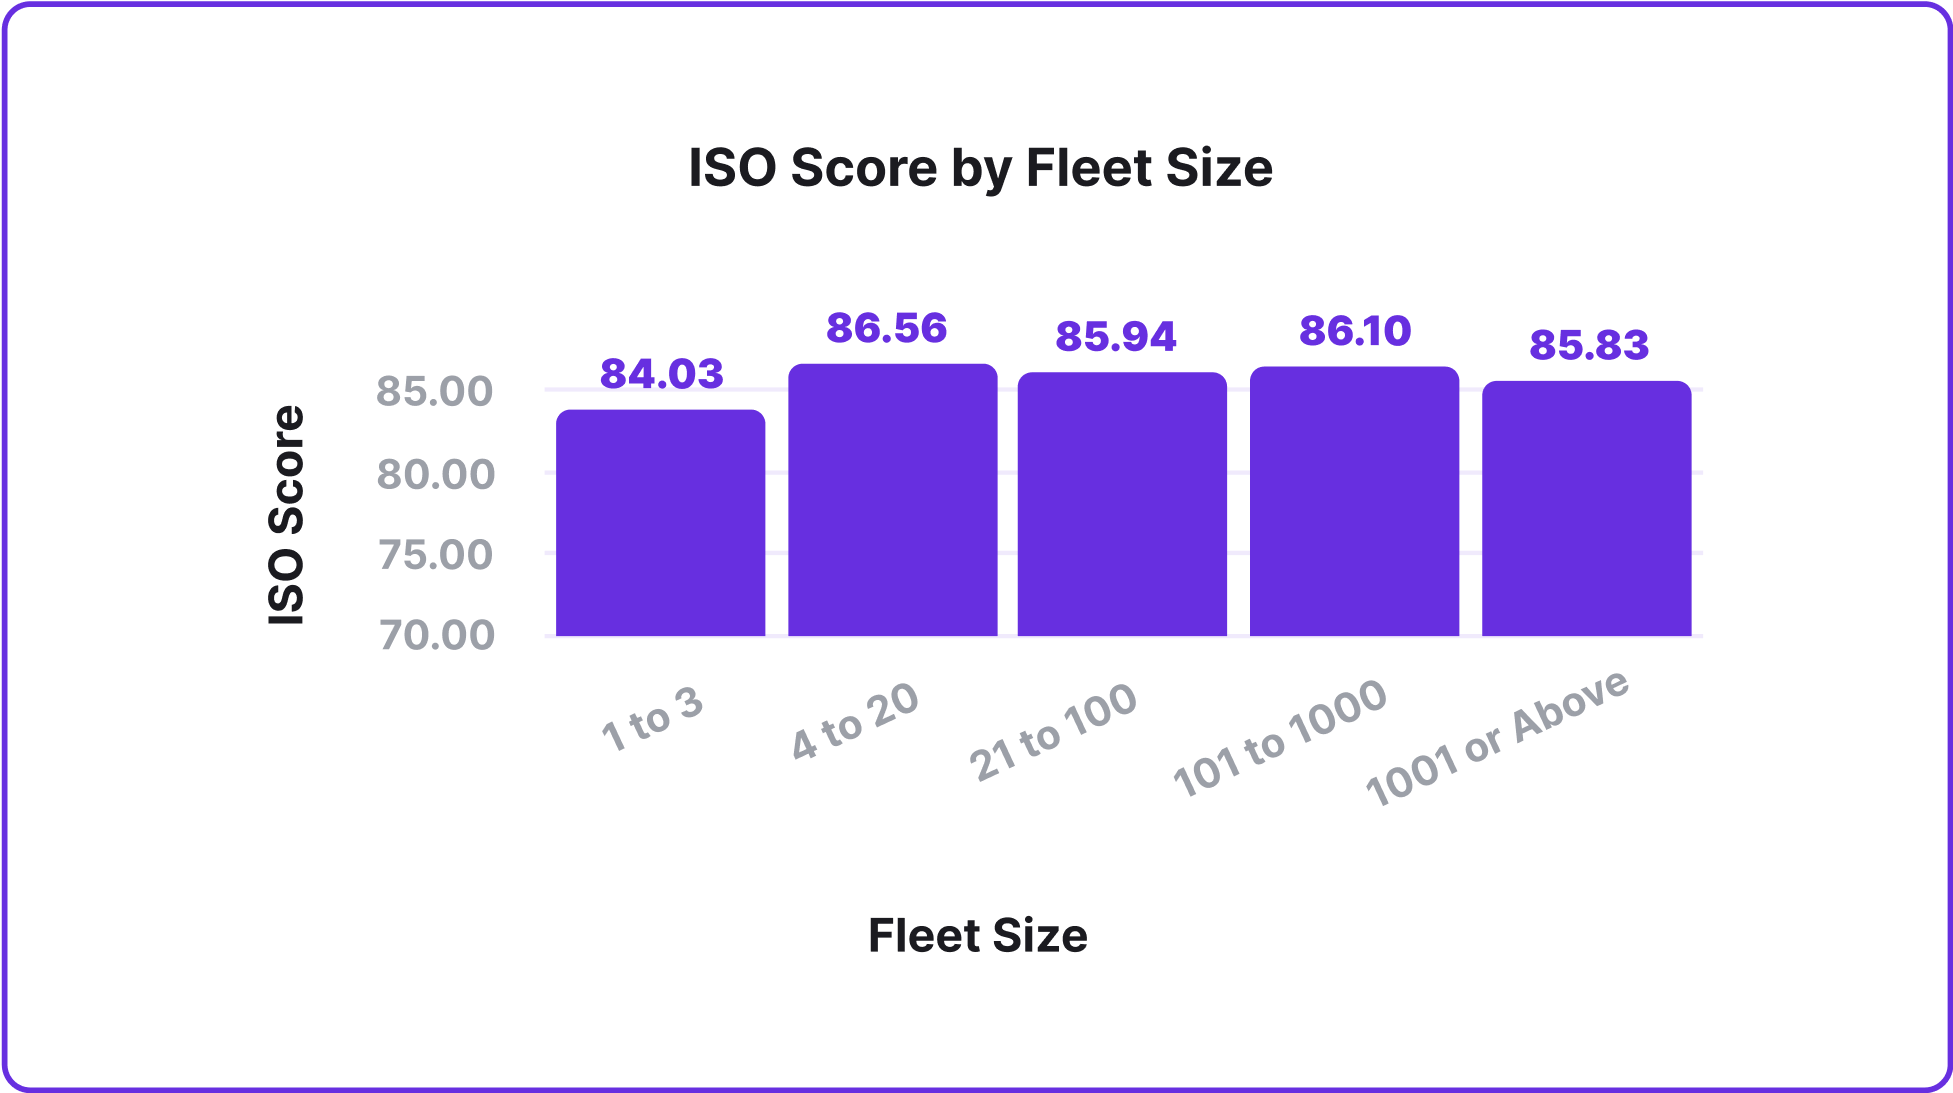
Fleet size impacts performance
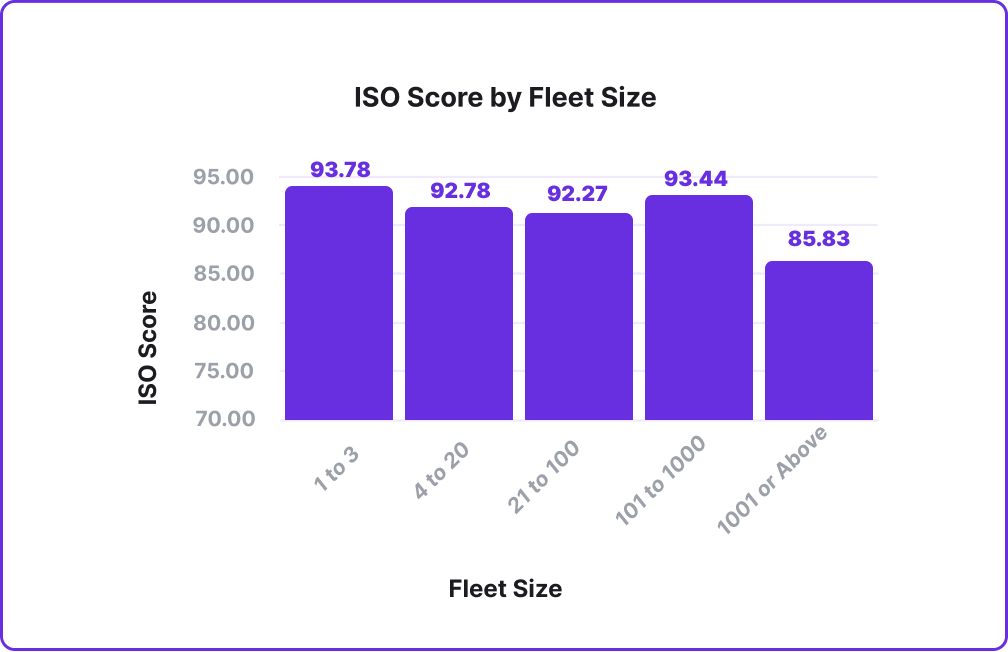
Data taken from Shipper Service Index Benchmarks
Fleet size matters according to our data. Smaller fleets outperformed much larger carriers in consistency and reliability. This demonstrates the importance of prioritizing mutually beneficial relationships when possible, whether you are a broker or a shipper. Some fleets are set up to, or more incentivized to, deliver better service for you.
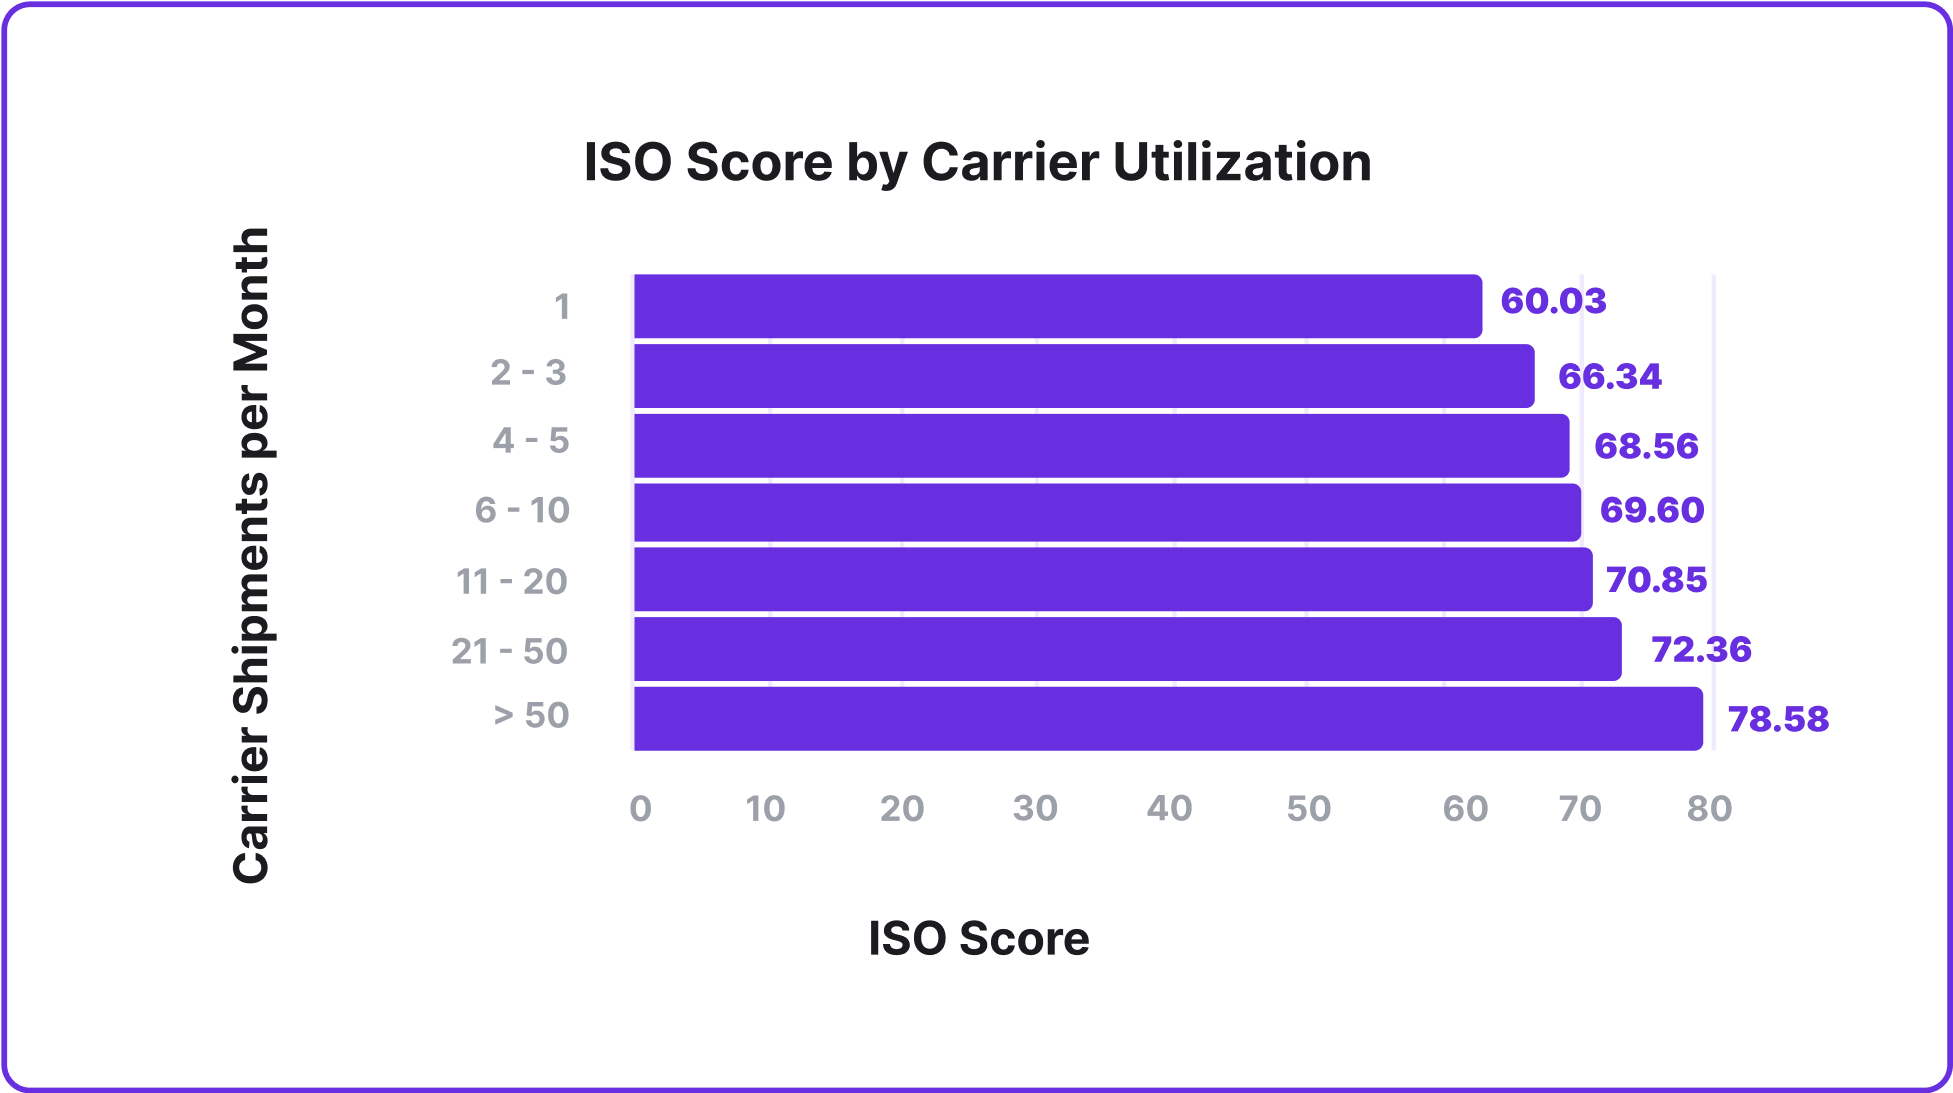
Carrier utilization matters
Brokers who established ongoing relationships with carriers saw stronger service levels. When you focus on carrier re-use, there are a number of benefits for your operation, and improved service reliability is one of them.
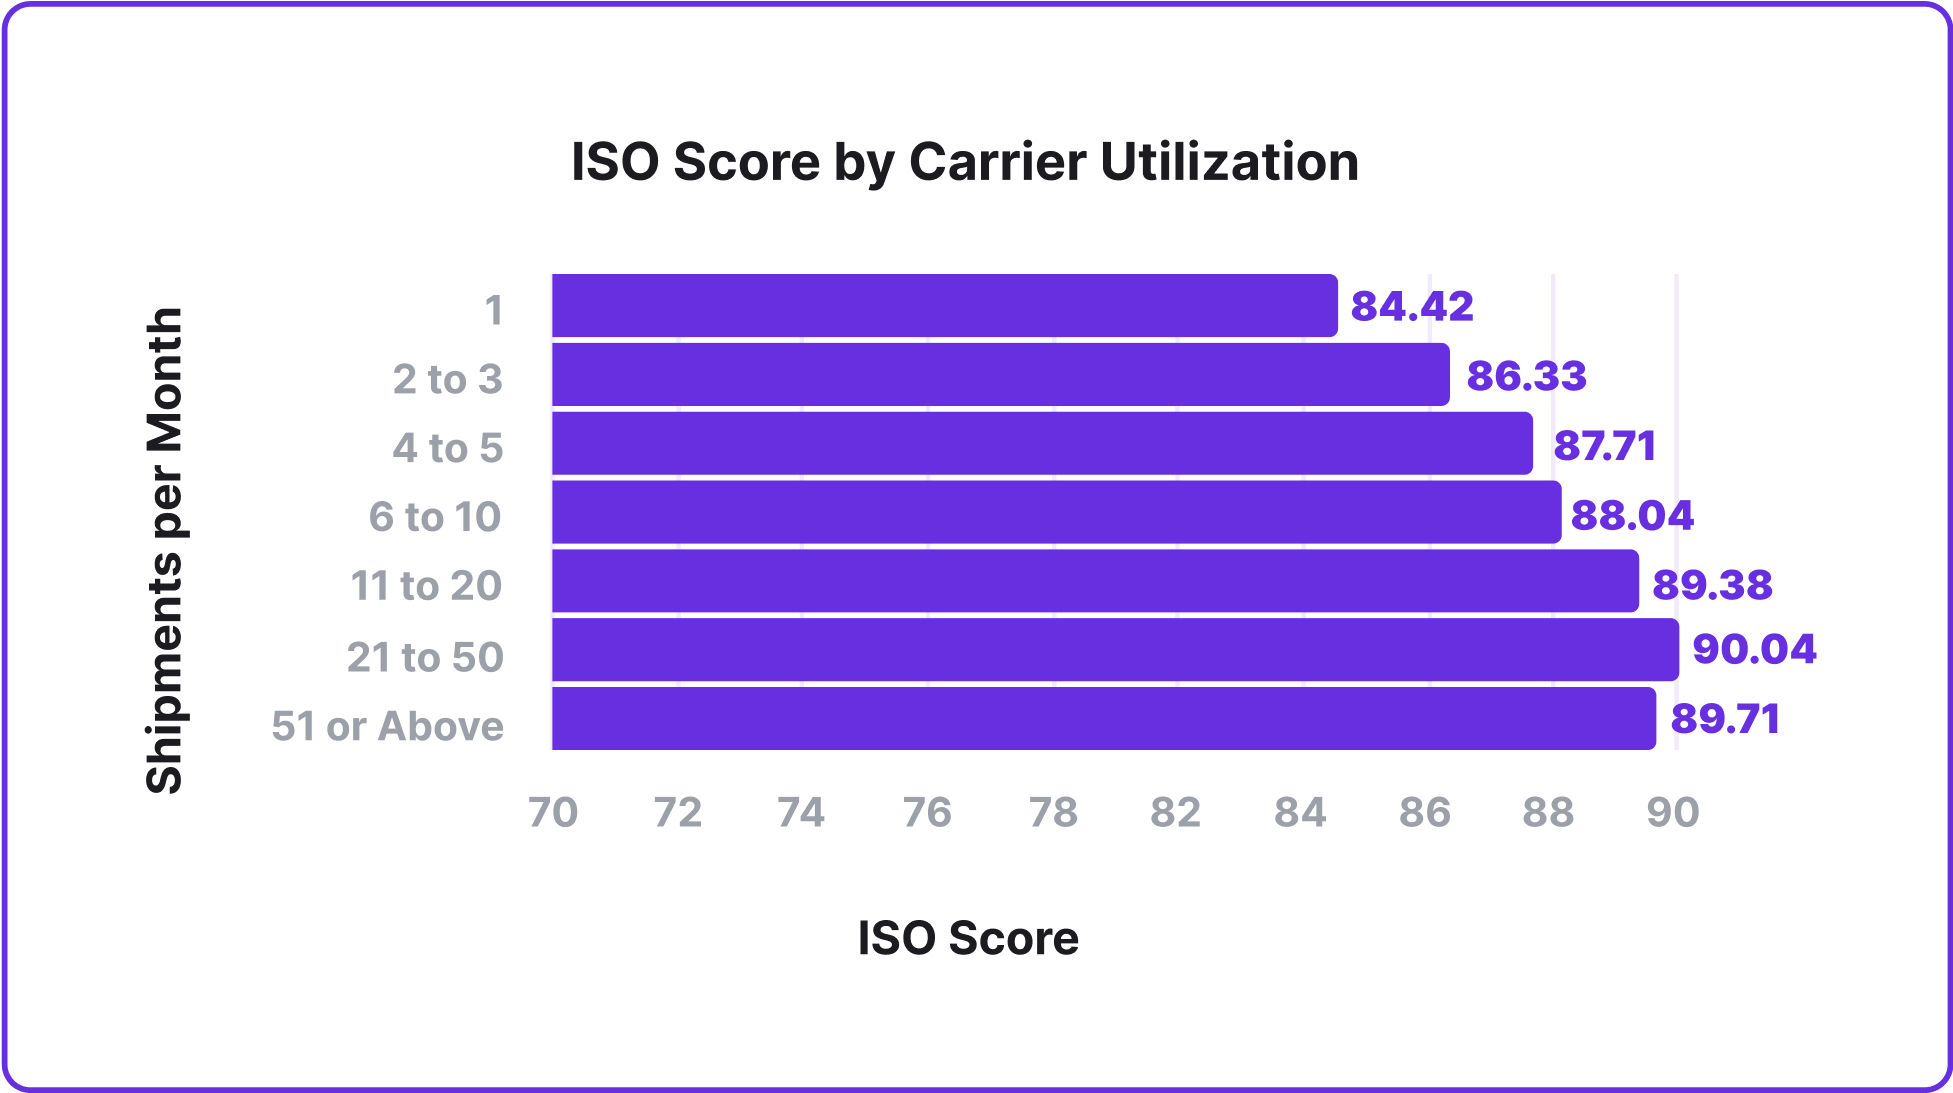
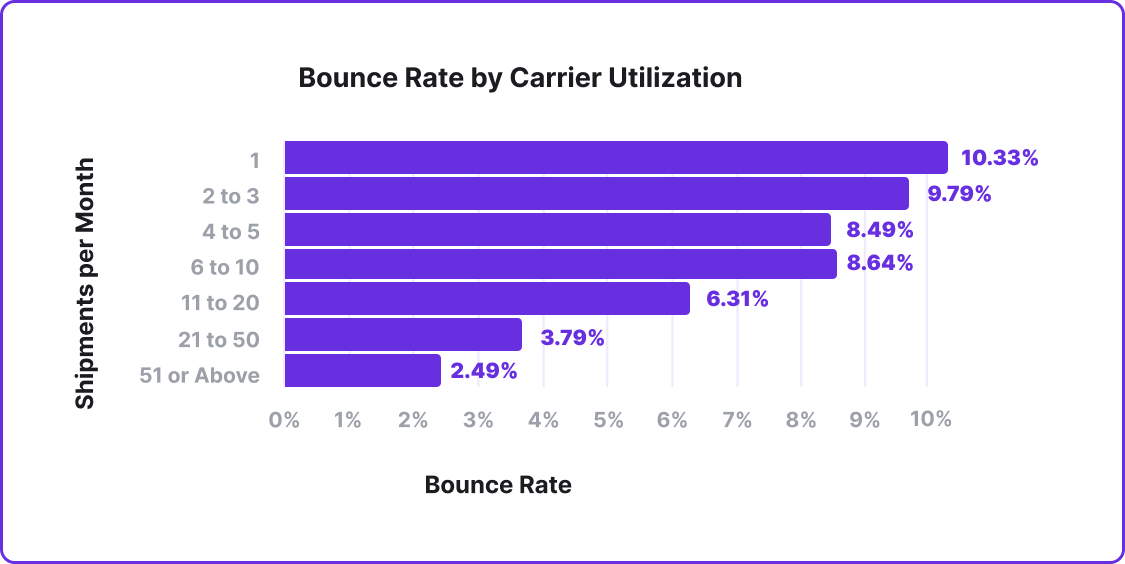
Data from Broker Service Index Benchmarks
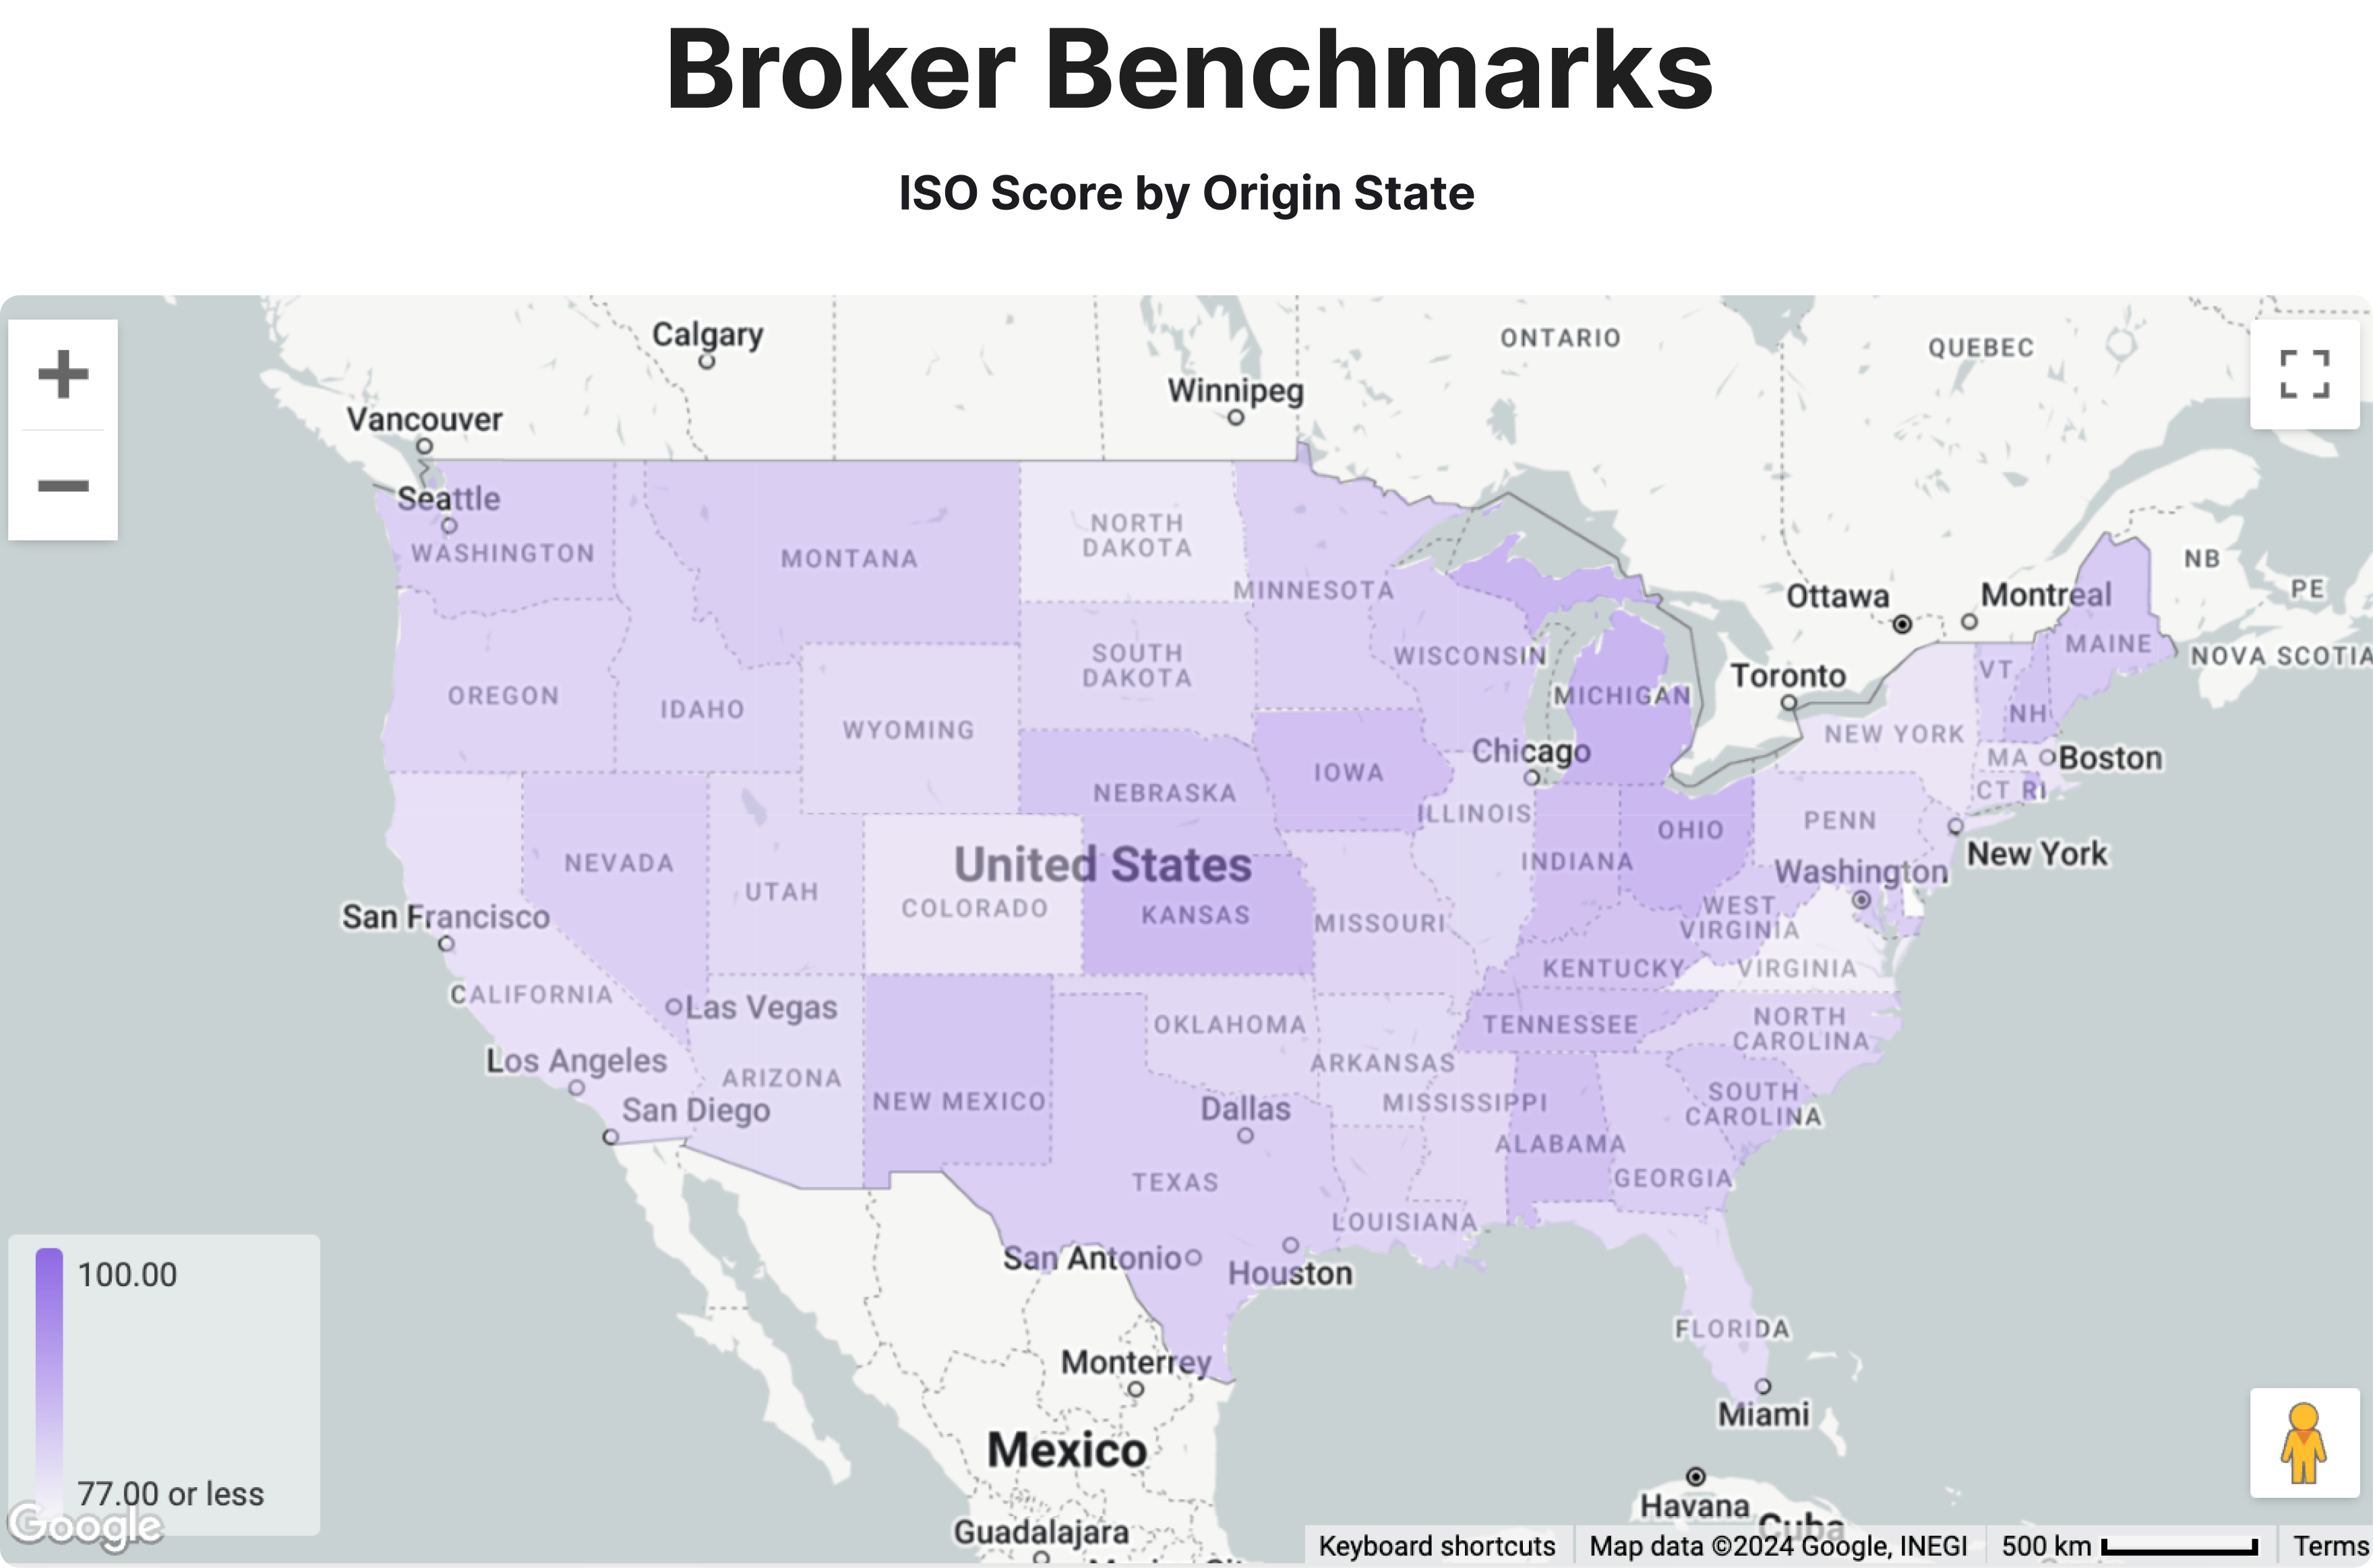
You get what you pay for regionally
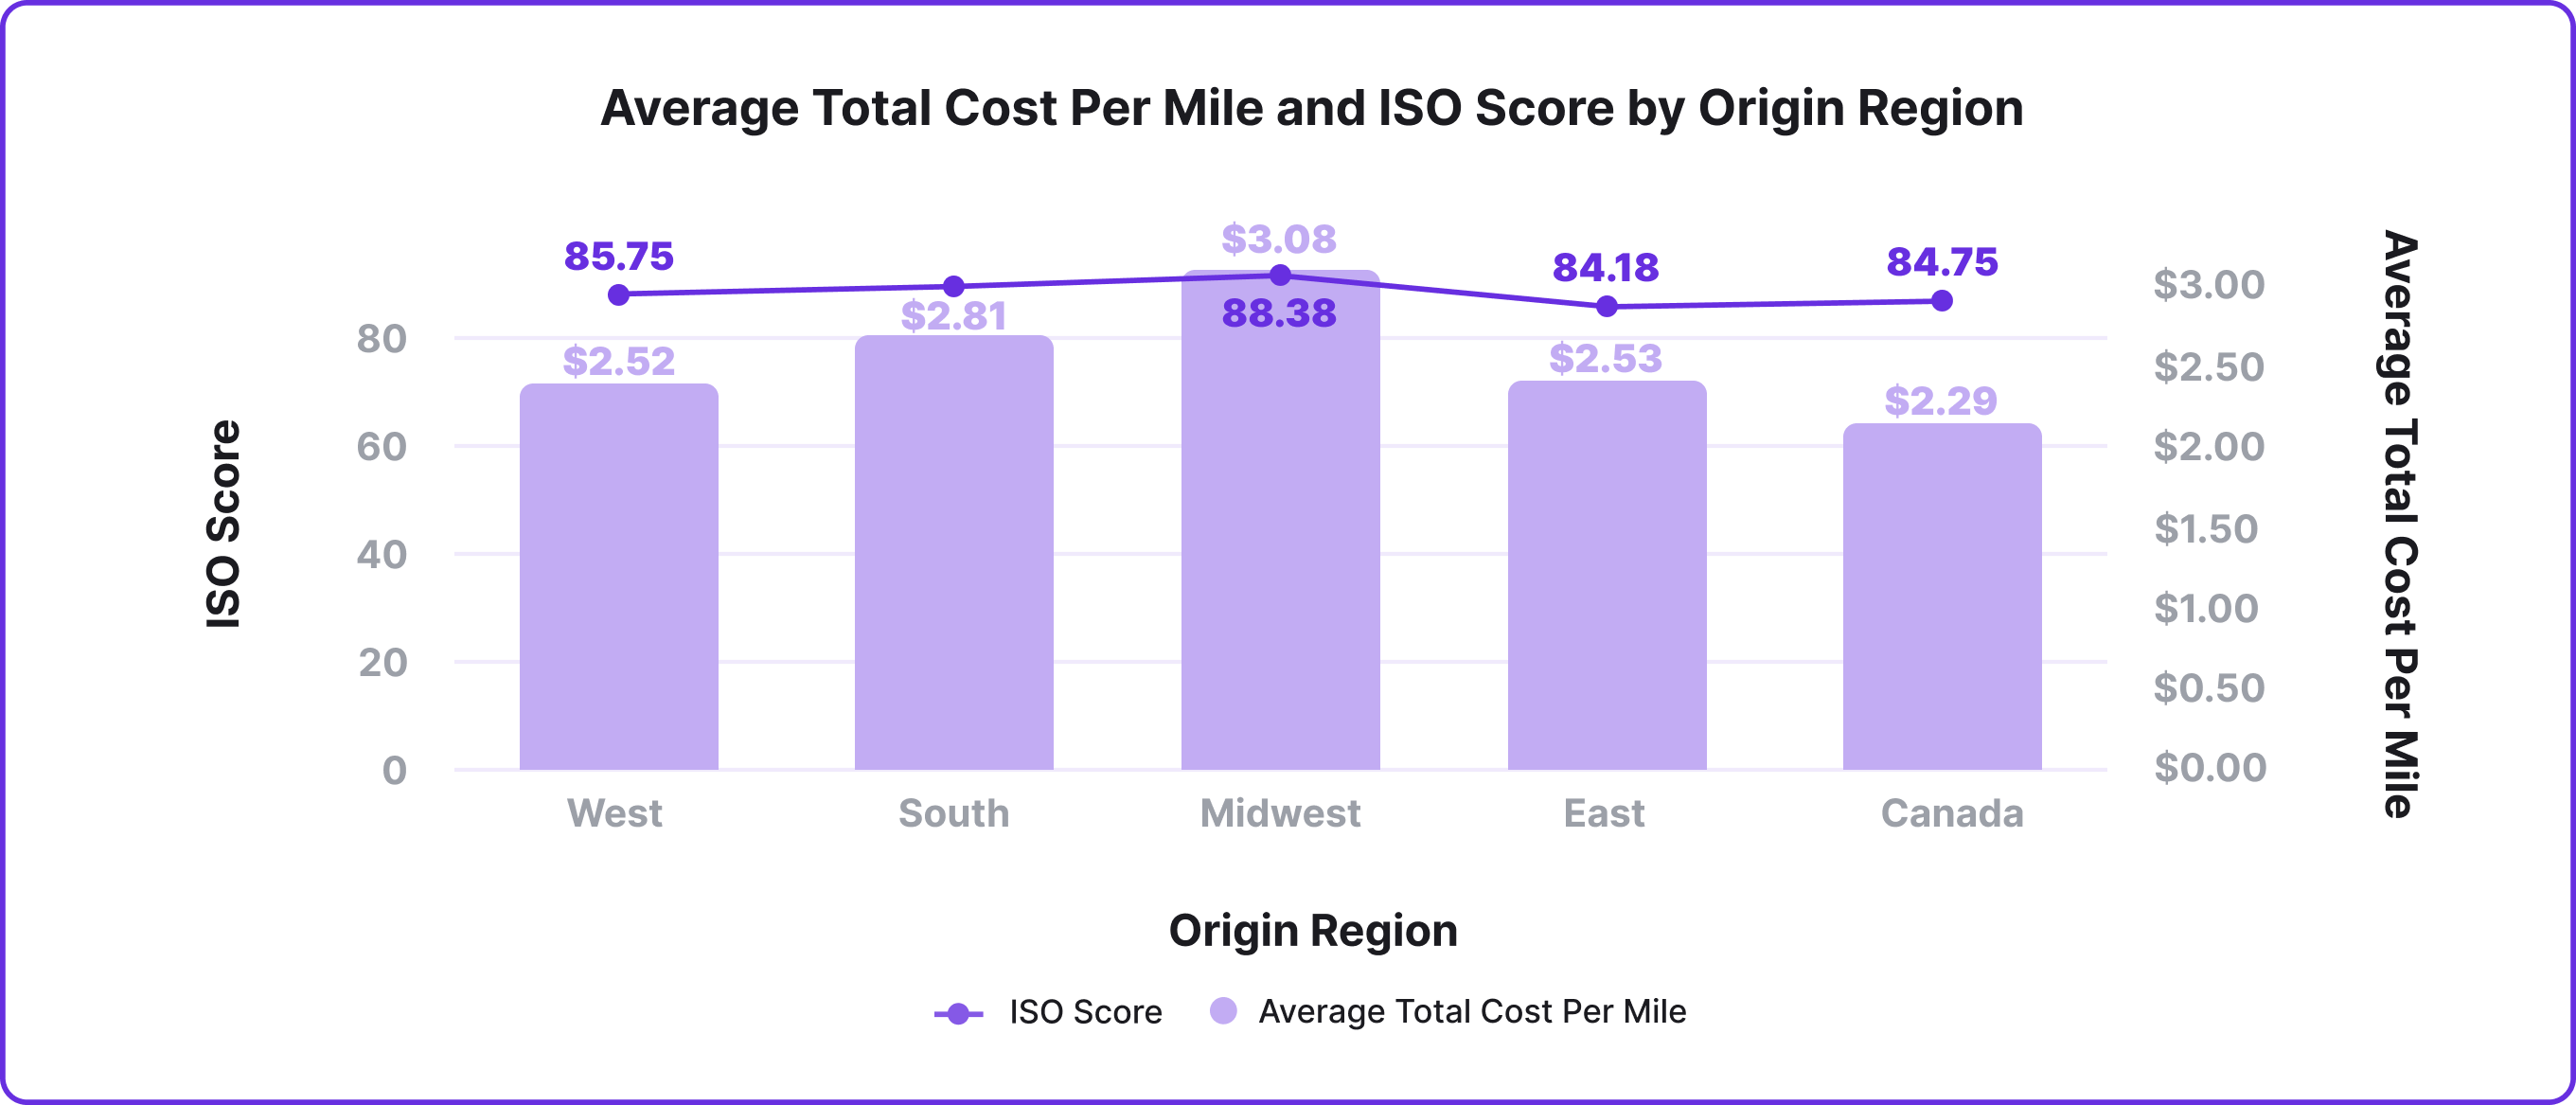
Data from Broker Service Index
Not surprisingly, the average total cost per mile varies by origin region due to fuel prices, insurance, and maintenance costs. However, a significant share of total costs per mile is typically driver wages. A fair wage provides motivated and dependable drivers, which, in turn, leads to efficient processes on the operational level.
The average total cost per mile is highest in the Midwest at $3.08 per mile, where we also see the highest overall ISO Score, followed by the South at $2.81 and the lowest, at $2.29 in Canada.
ISO Service Benchmarks: A First Half of 2024 Overview
ISO’s benchmark report offers several charts illustrating allowing shippers and brokers to compare their service levels against the market. They also underscore the hidden costs associated with poor transportation service.
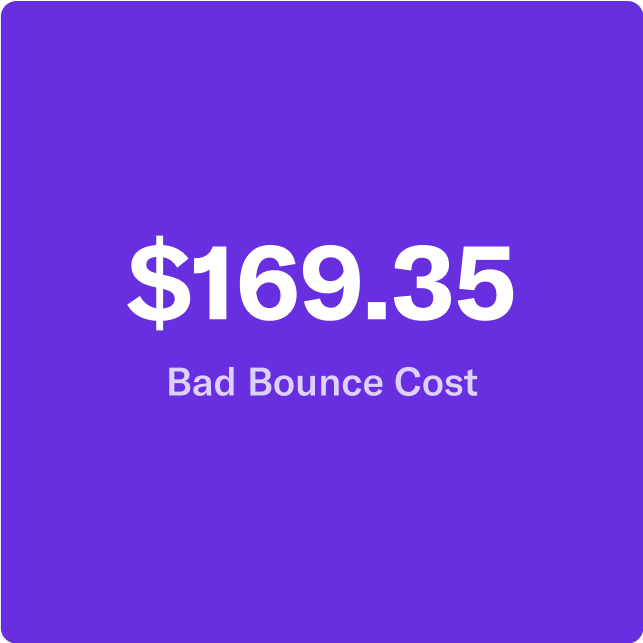
For example, in the Broker Service Index Benchmarks, note that the average incremental cost of a bad bounce was nearly $170 based on the recovery rates alone during the first half of this year. Service failures, like bad bounces, come with a major cost.
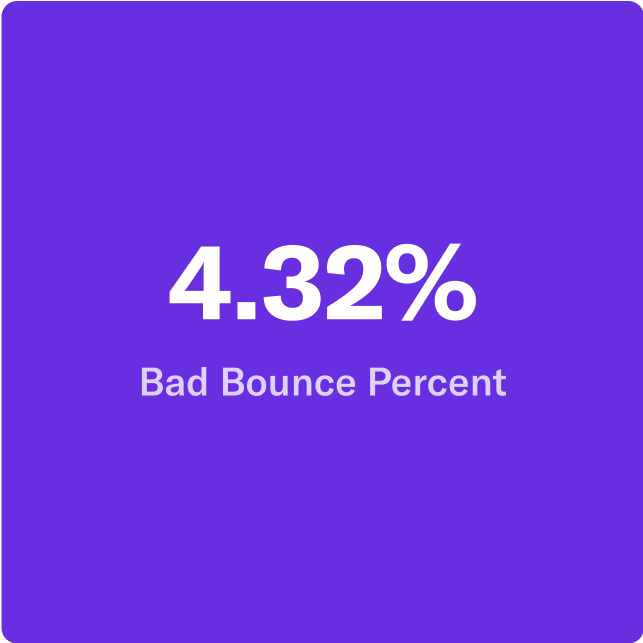
Unknown or new carriers were found to be 8% more likely to bounce a load, which is why learning a carrier’s strengths and building mutually beneficial relationships with trusted carriers is so important.
Minimizing bad bounces by selecting reliable carriers can save brokers from unnecessary financial losses.
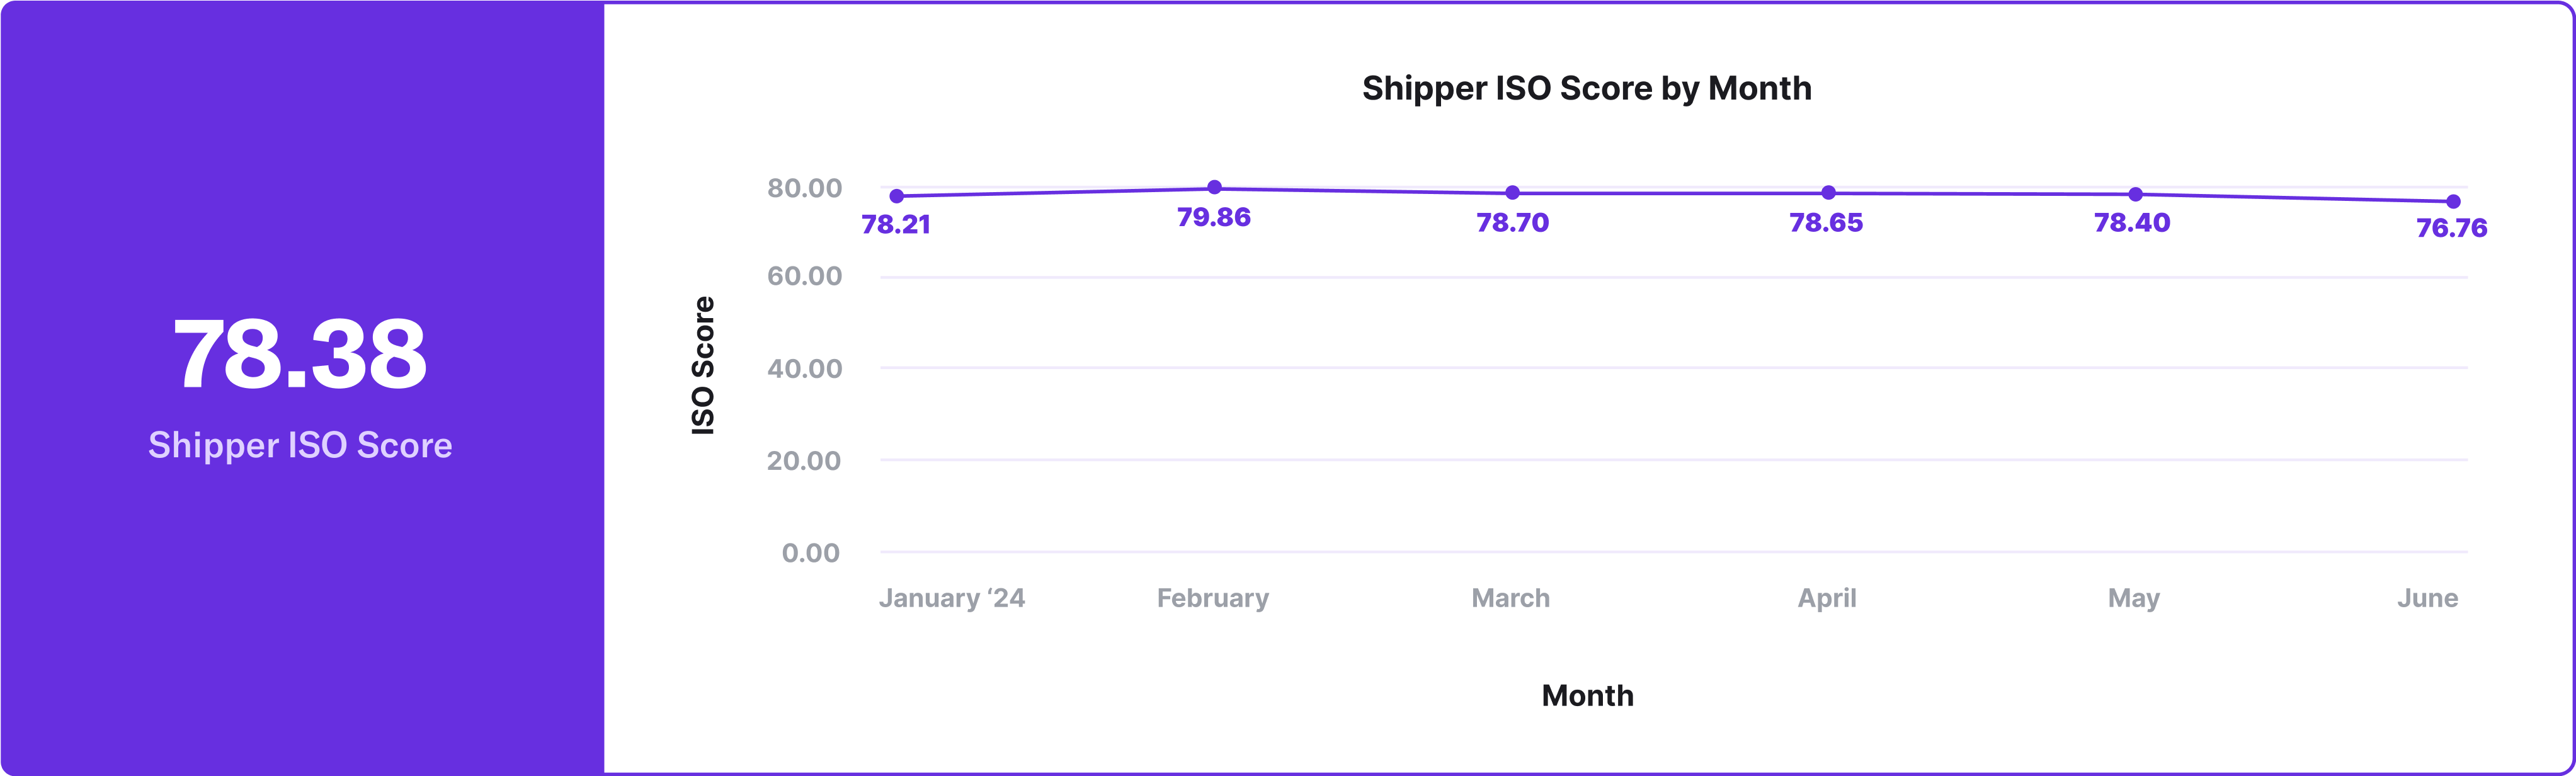
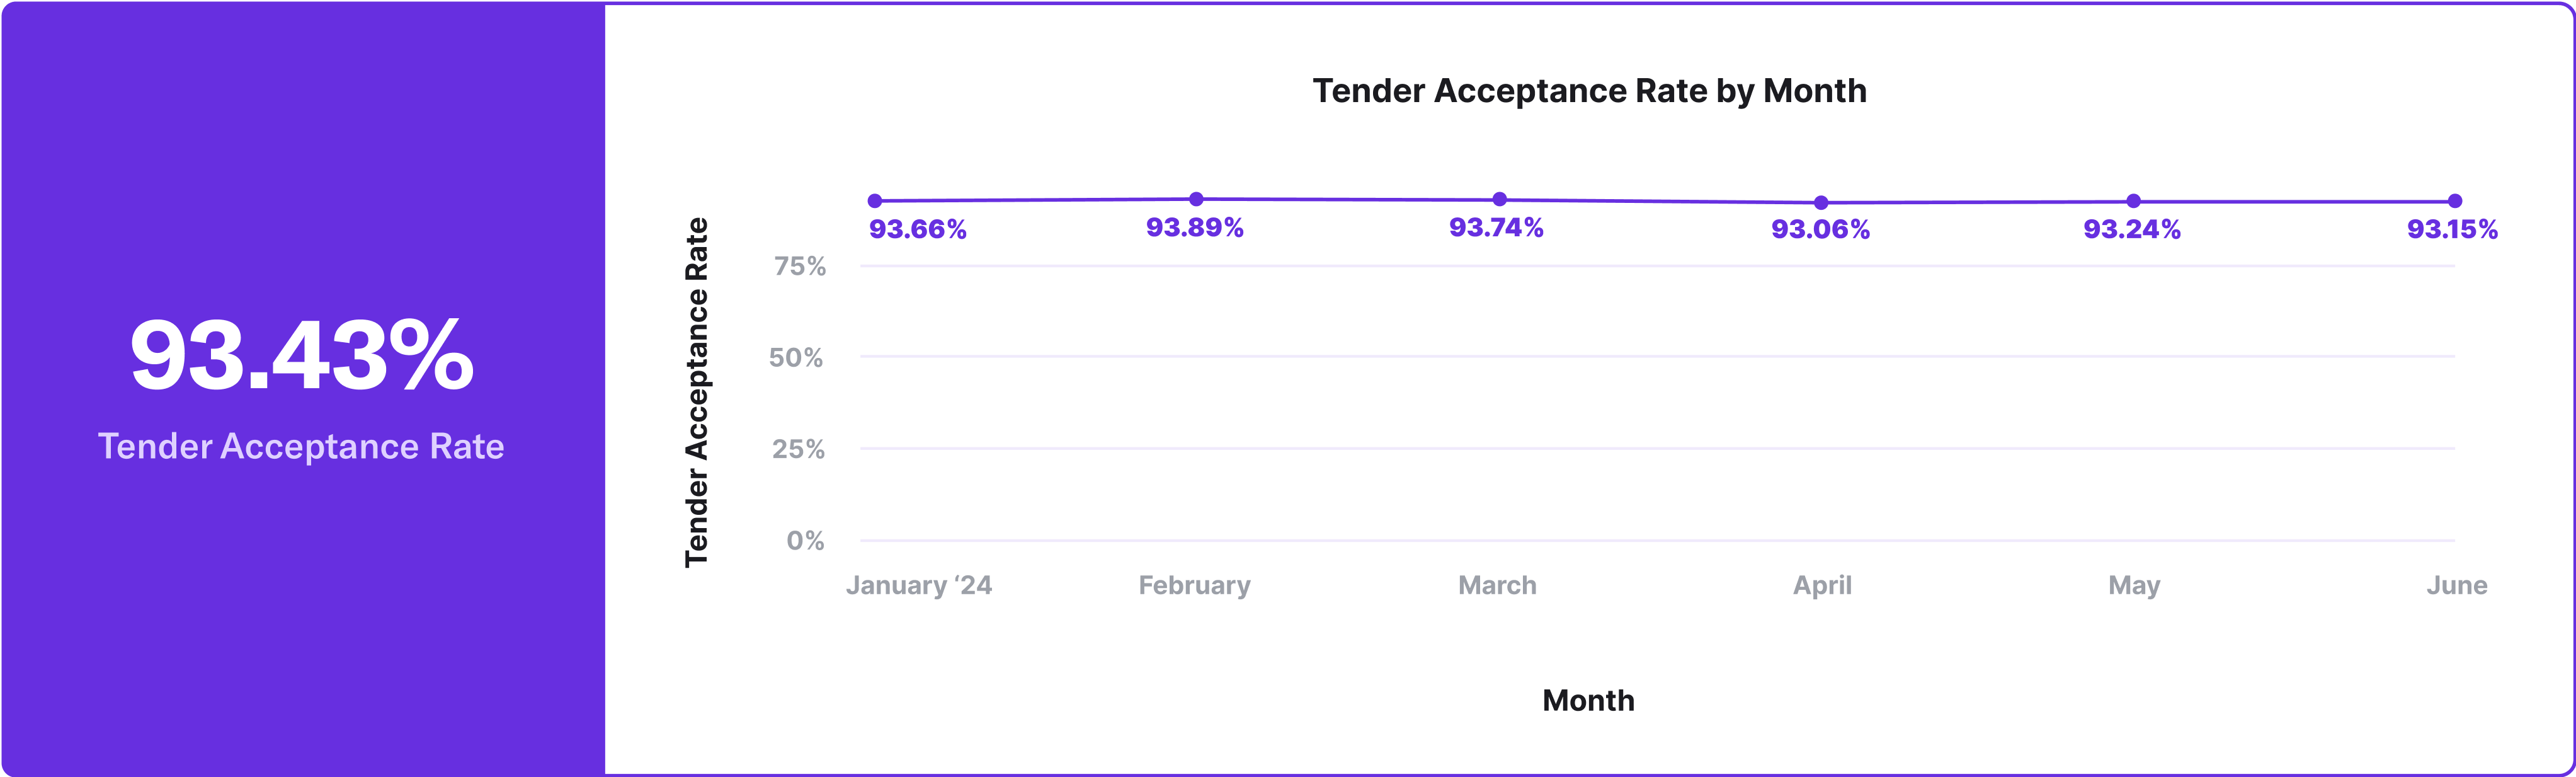
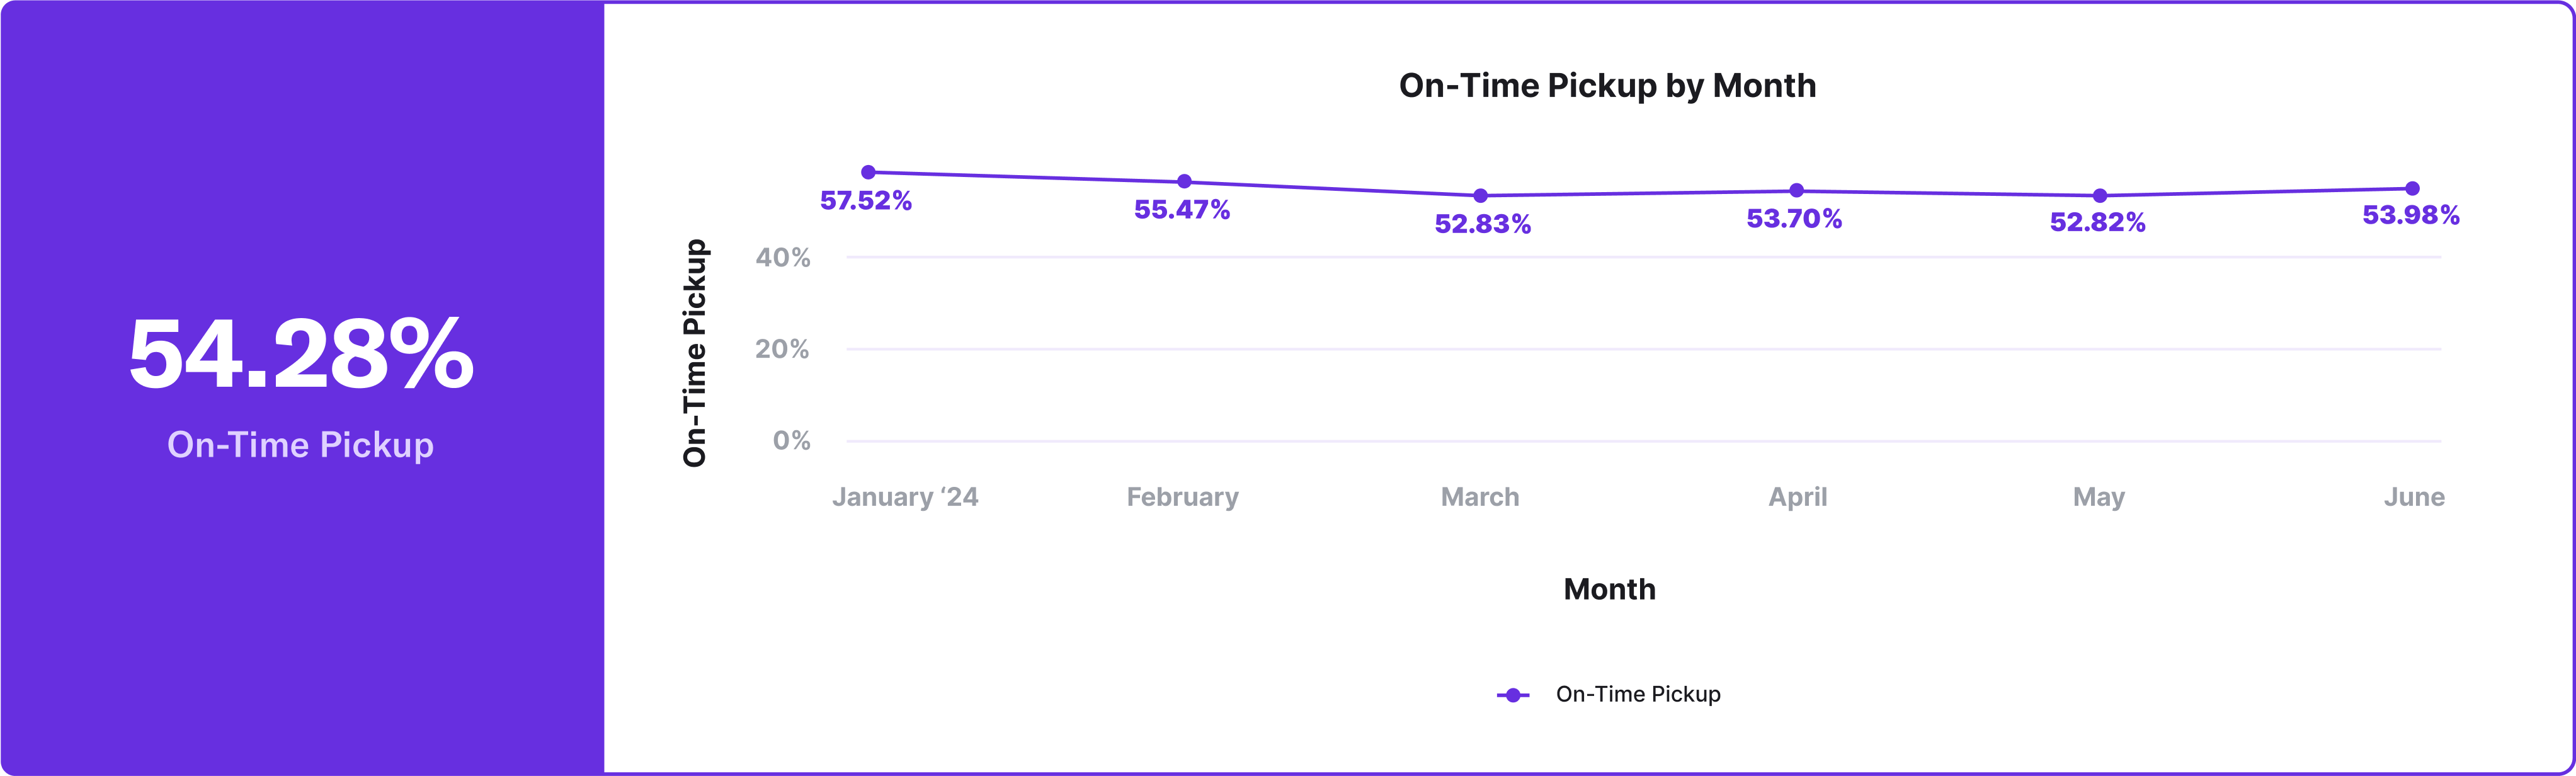
ISO Shipper Service Index Benchmarks
This data is based on the standardized service metrics ISO measures across our network of enterprise, Fortune 1000 shippers. The data is pulled from January 1st – June 30th, 2024.
Note: The ISO Score for shippers is a composite score intended to benchmark overall service reliability and performance. It is a 0-100 composite of standardized service KPIs On-Time Pickup, On-Time Delivery, and Tender Acceptance.

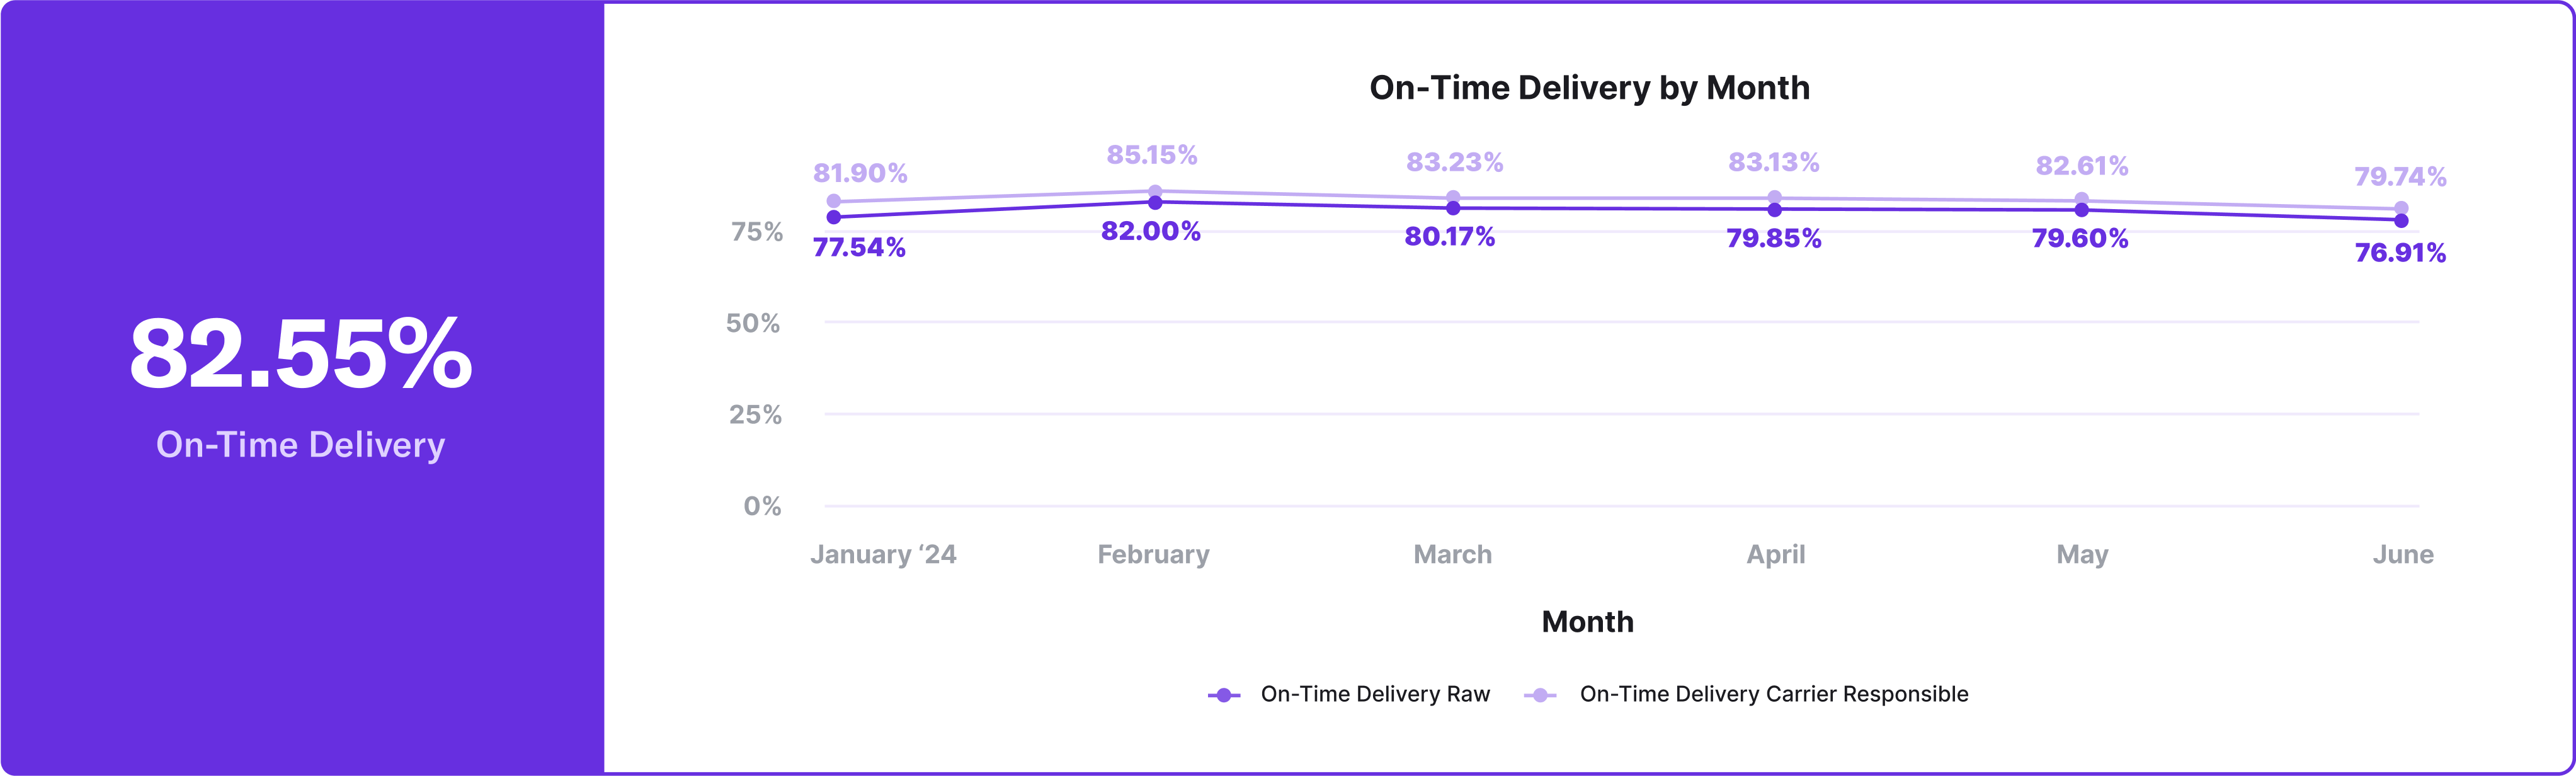
Here we highlight both the benchmarks for the raw On-Time Delivery our shippers initially measure, as well as the On-time Delivery rate they see after the ISO workflow where all carrier responsible late deliveries are accounted for. The roughly 3-4% difference in every month highlights the importance of verifying service data with carriers.
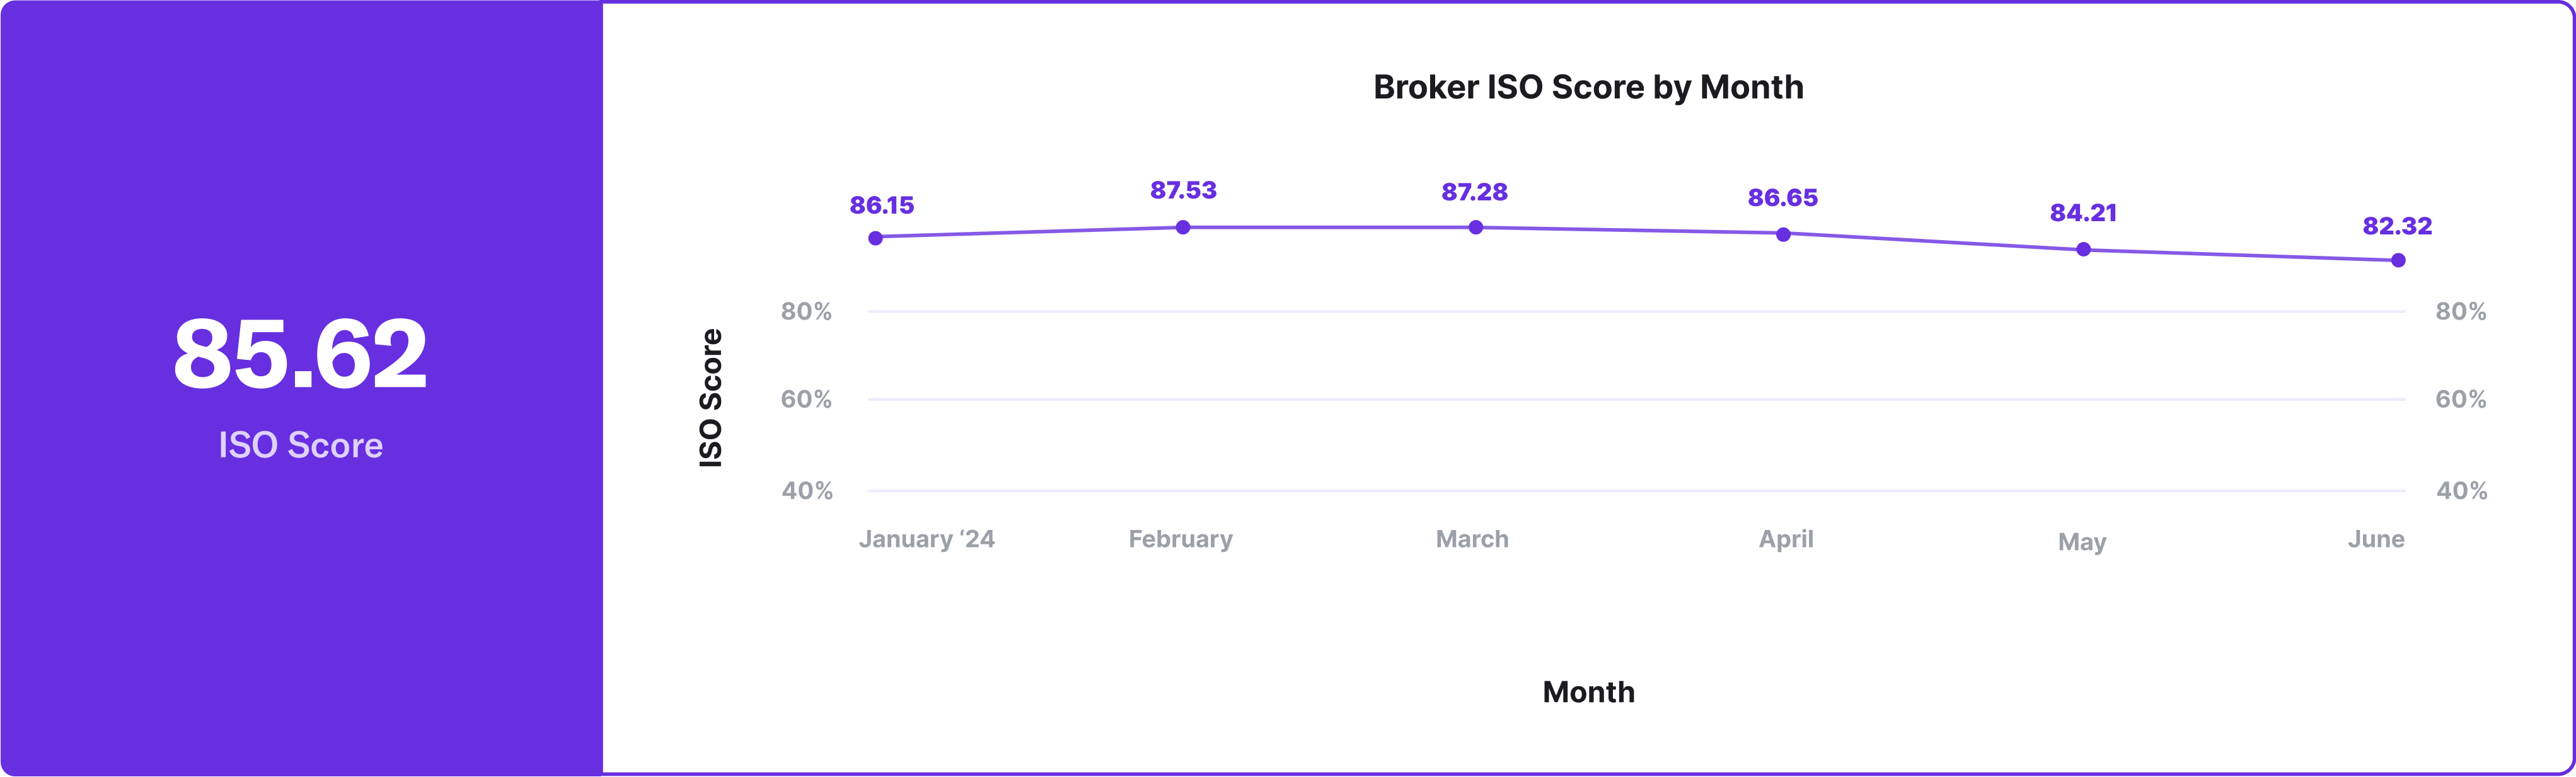
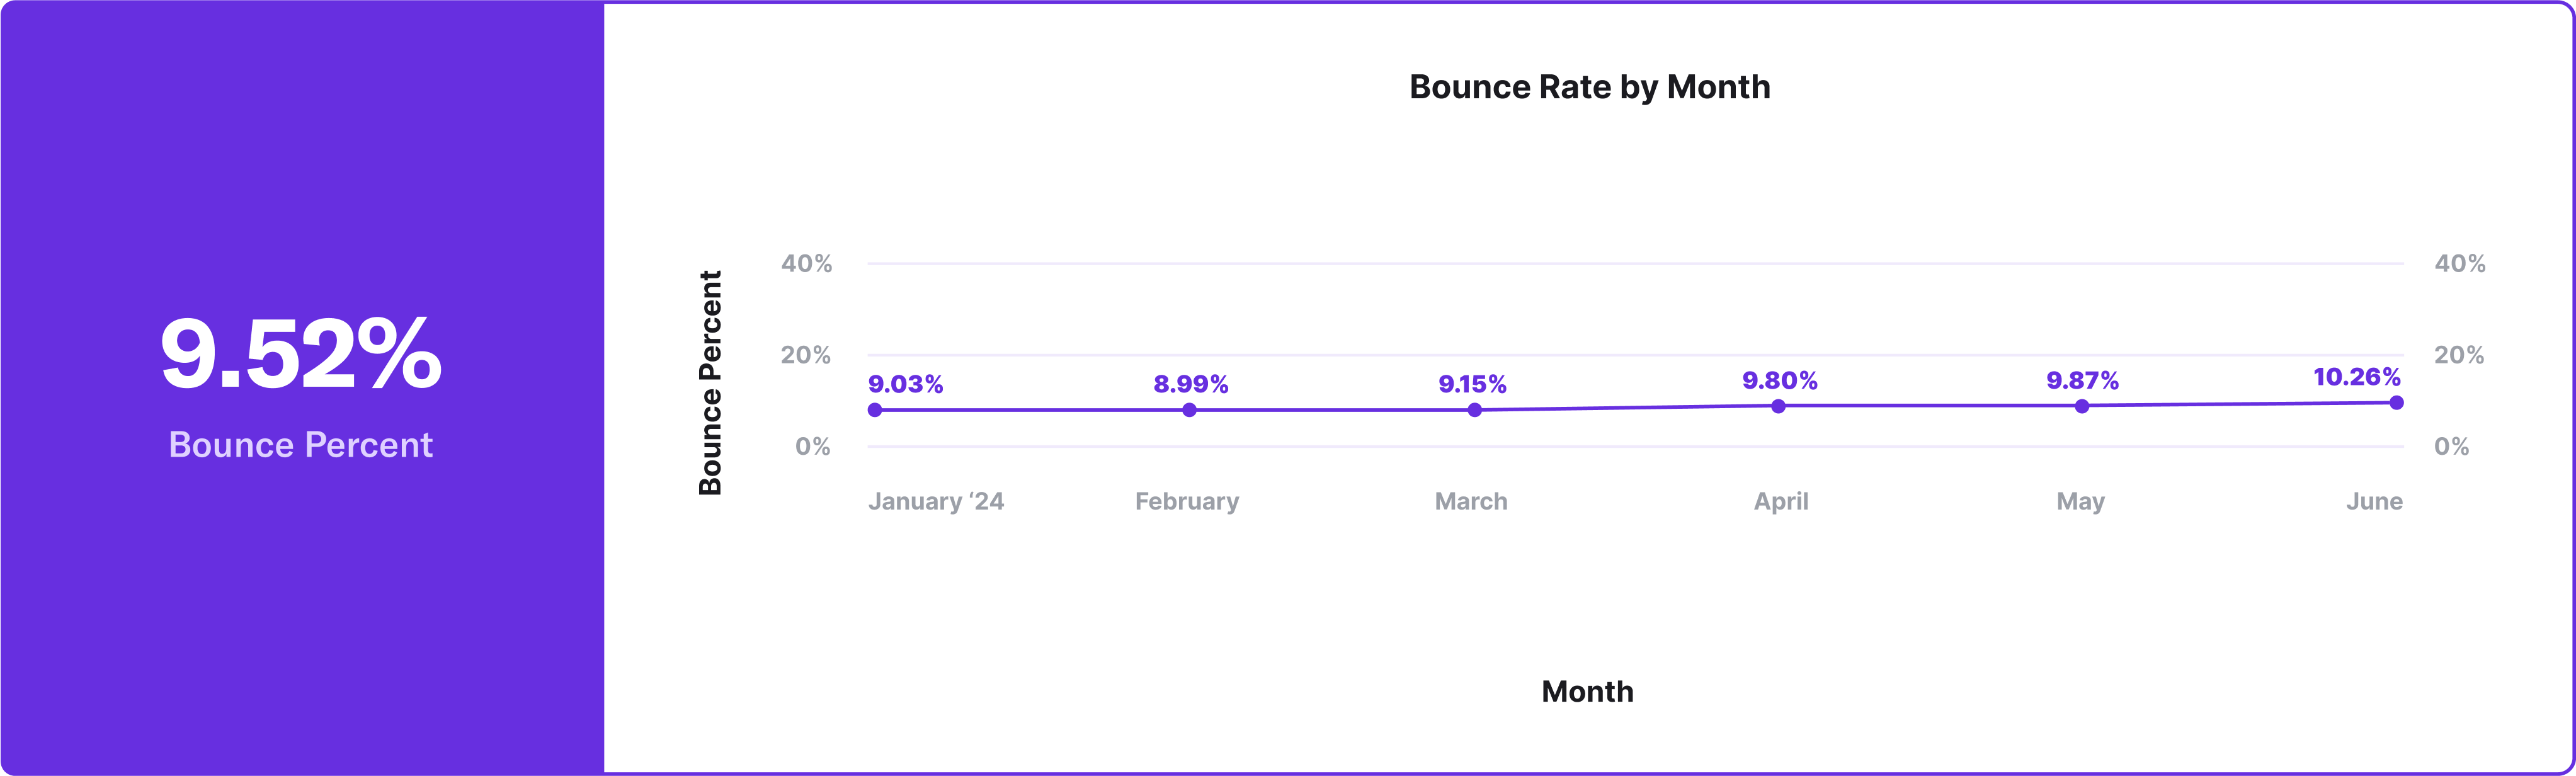
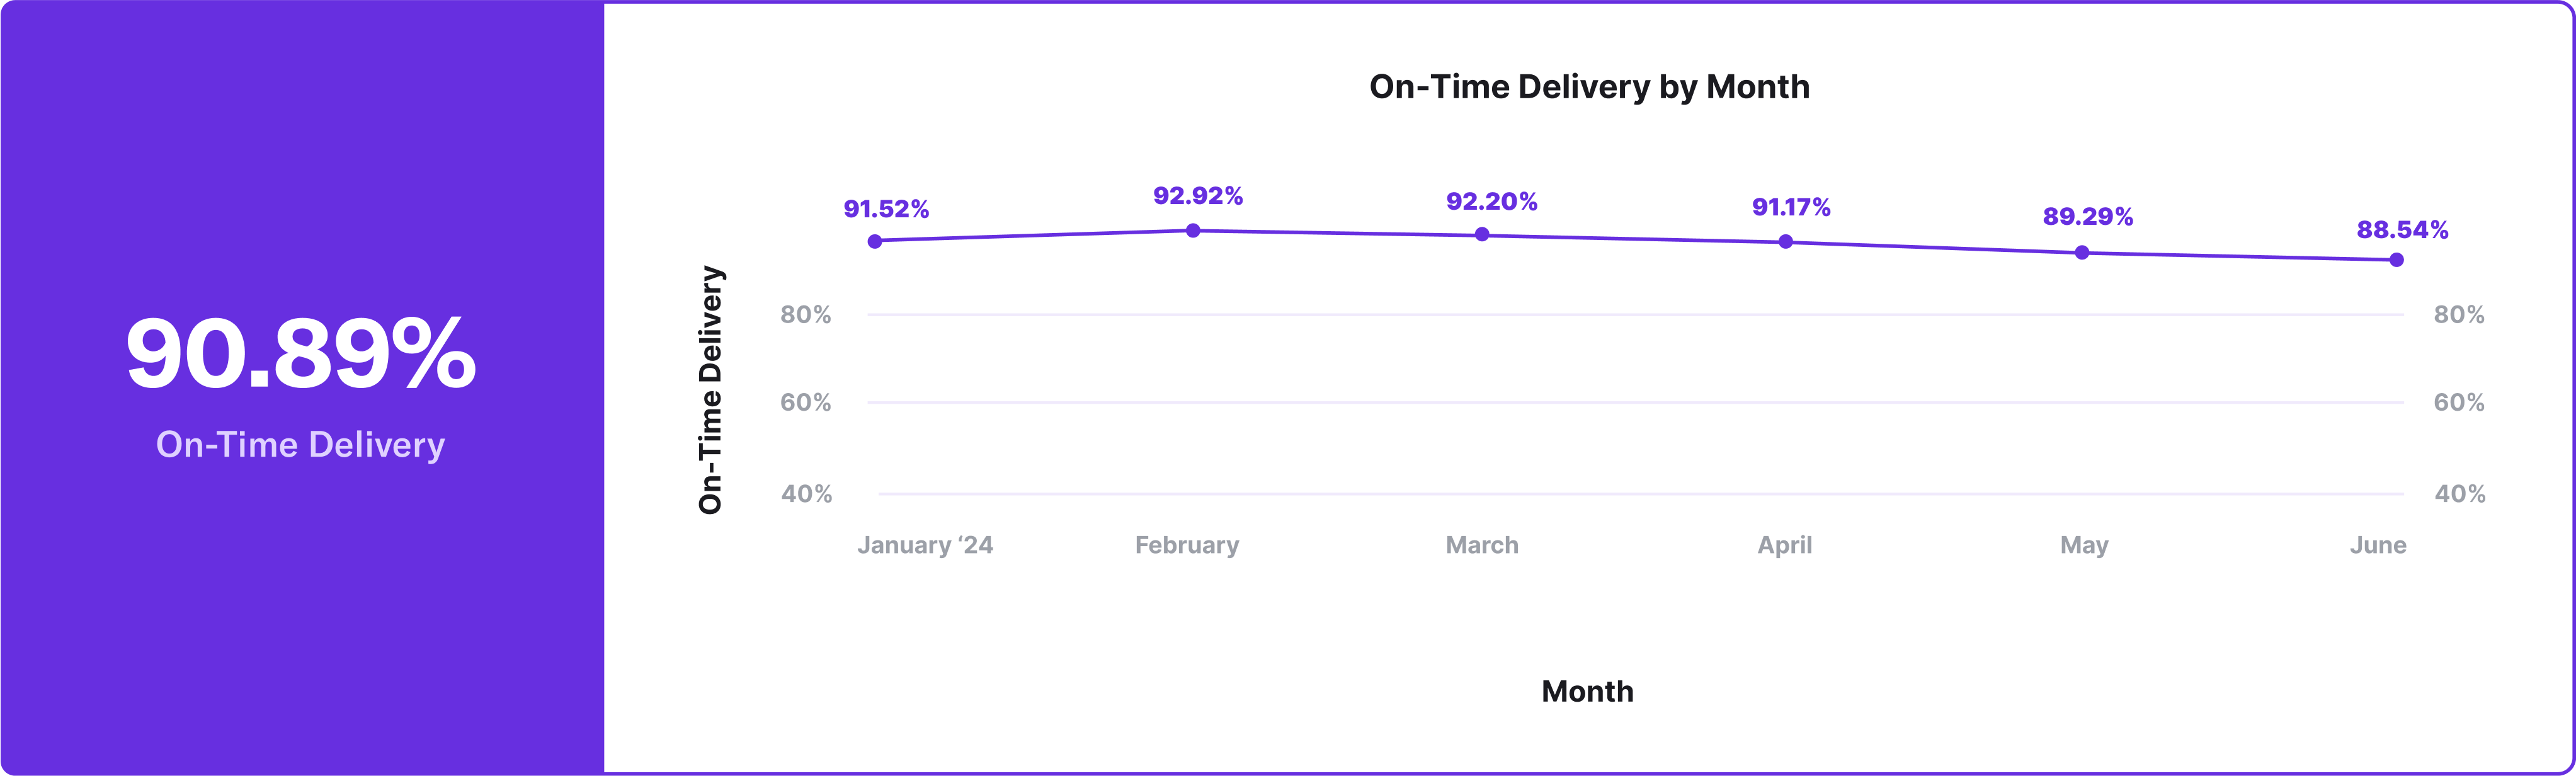
ISO Broker Service Index Benchmarks
This data is based on the standardized service metrics ISO measures across our network of Freight Brokers and Logistics Service Providers, based on the underlying performance of their carrier networks. The data is pulled from January 1st – June 30th, 2024.
Note: The ISO Score for brokers is a composite score intended to benchmark overall service reliability and performance. It is a 0-100 composite of standardized service KPIs On-Time Pickup, On-Time Delivery, and Bounce Rate.
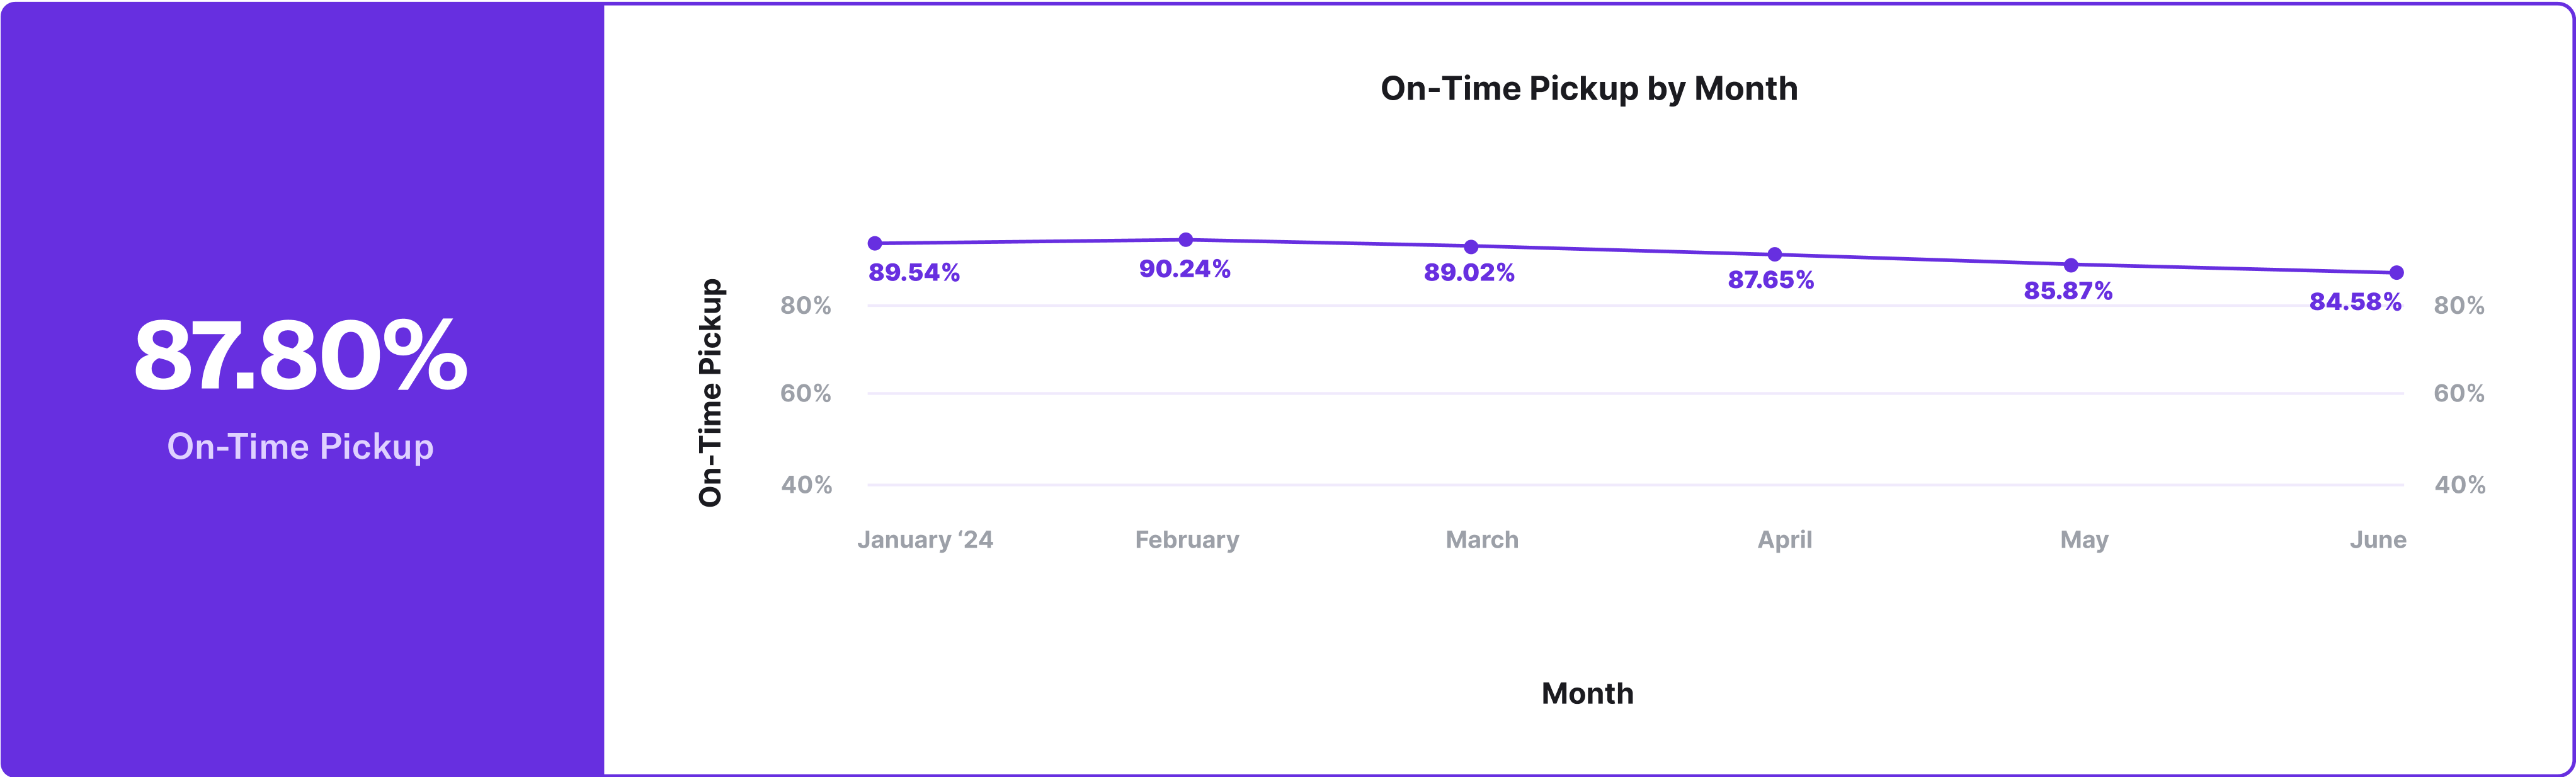
(within 4 hours of pickup)

Implications for Brokers and Shippers
Optimizing freight service levels has become crucial for businesses striving to maintain a competitive edge. While price remains a significant factor in transportation decisions, focusing solely on cost can lead to compromises in reliability and speed. As such, shippers are increasingly prioritizing on-time deliveries and consistent service and are turning to brokers for assistance.
The proliferation of On-Time In-Full (OTIF) and vendor compliance programs has also heightened the expectations placed on brokers and necessitates that brokers maintain strong relationships with carriers and implement robust tracking and reporting mechanisms to ensure that performance aligns with the needs of their customers.
Brokers can take several actionable steps based on key factors identified in ISO’s data:
- Invest in technology that enhances visibility and tracking capabilities.
- Regularly gather and analyze client feedback to identify pain points and areas for improvement. By actively engaging with shippers to understand their needs and adapting their services accordingly, brokers can foster stronger relationships and demonstrate a commitment to quality.
- Learn the strengths of the carriers in your network. The key to establishing partnerships with reliable carriers is to show them that you understand their needs, strengths, and are serving them mutually beneficial freight.
To improve their overall network performance and eliminate hidden costs or service, shippers should:
- Prioritize reliability and consistency for their most important and valuable customers. Not all lanes require white glove service, but you need to understand the ones that do so you can give that freight to the carriers you know value your business most.
- Ensure you understand the vendor compliance programs of your customers, and can trace that back to your carriers’ service performance.
- Regularly scorecard your carriers, and give them a seat at the table via regular performance reviews and QBRs.
Looking Ahead
In today’s freight market, prioritizing service performance is essential to maintain customer satisfaction and loyalty. Timely deliveries, reliable communication, and overall service reliability are becoming increasingly important as shippers demand greater transparency and responsiveness from their freight partners.
Despite some green shoots of improving demand, the freight market remains in a recession and is expected to continue into at least the first quarter of 2025. Analysts cite the need for more capacity to leave the market before there are any noticeable signs of improvement. To ensure you are not impacted by the tightening market, make sure your service levels are an indispensable part of your customer’s network.
Moving forward, ISO aims to establish a regular cadence for publishing reports such as this to highlight trends in the market.