
2023 ISO Awards and Year in Performance
ISO 2023 Award Winners & Year in Performance Infographic
“Pressure is a privilege” – Billie Jean King
What a year! 2023 will go down as one of the most challenging in recent memory for many across the logistics industry. Between deflationary pricing, excess capacity, consolidation and large players exiting the market, it was a tough year in freight. As we prepare for better times ahead and announce the top performing carriers in the country, we at ISO first would like to take this opportunity to reflect on the importance of service in our increasingly competitive service-based industry.
The logistics landscape has shifted to the point that shippers face more pressure to perform than ever. Consumers now demand stocked shelves, same-day delivery and instant gratification. As a result, retailers are levying more punitive vendor compliance programs and OTIF fines. Service-level performance is now currency in our supply chains.
With that stage set, we’re thrilled to have the unique opportunity to observe service trends, benchmarks and top performers across our network of shippers and logistics service providers. This year, we’re getting a little more granular with our data. Here’s what happened in transportation performance in 2023:
Year in Review: Performance Insights
2023 performance at a glance
- Average ISO Score: 78.86
- Average Contract Tender Acceptance: 89.75%
- Average OTD: 79.89%
- Average OTP: 61.12%
- Average Cost to Serve: $153.28
Average OTD RDD for Major Retailers
- Target: 85.65%
- Kroger: 85.45%
- Costco: 82.65%
- Amazon: 74.84%
Average ISO Scores By Distance in Miles

- 0-50: 71.59
- 51-150: 83.87
- 151-550: 82.47
- 551-1000: 76.89
- 1001 or above: 74.54
Average ISO Scores By Source Region
- Canada: 81.76
- East: 79.47
- West: 75.41
- South: 79.51
- Midwest: 79.33
Average OTD to RDD for the ISO network: 77%
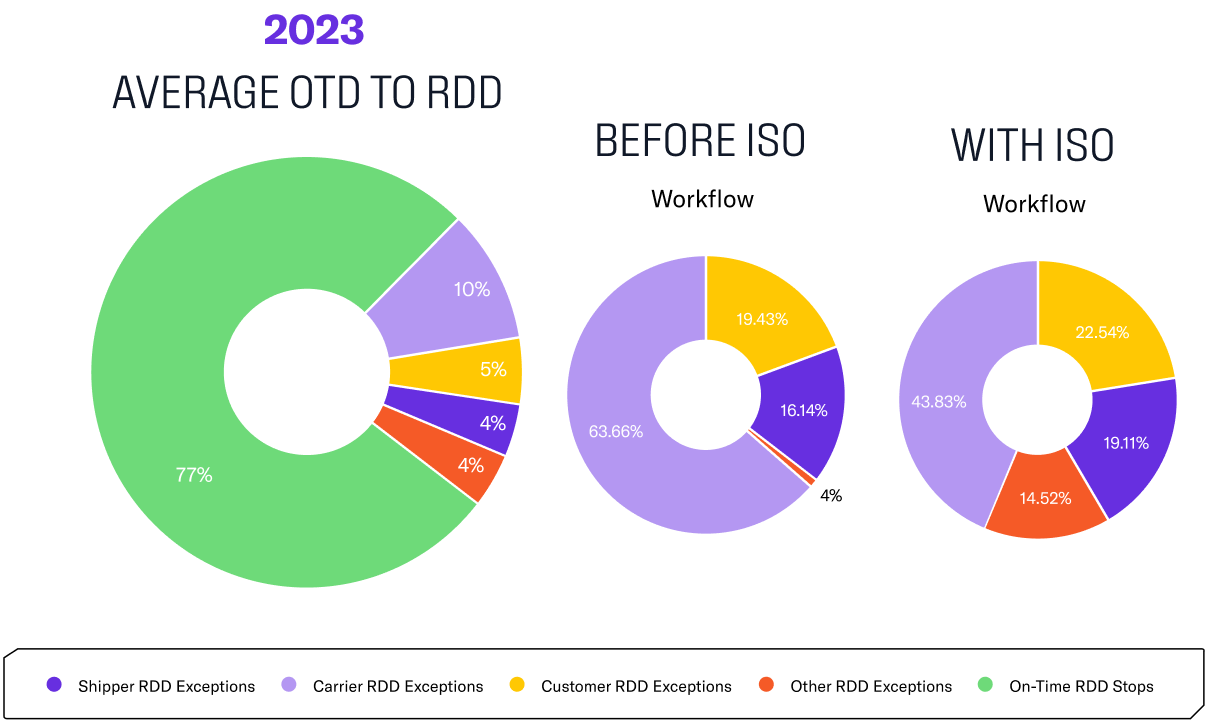
Who was responsible for the 23% of missed RDD appointments?
Before the ISO workflow, here’s the responsible party:
- 64% were carrier responsible
- 19% were customer responsible
- 16% were shipper responsible
- 4% other
And here’s a look at who was responsible after the shippers and carriers went through the ISO workflow:
- Only 44% of later deliveries were the carrier’s fault
- 23% were the retailers fault
- 19% shipper responsible
- And 14% had no clear responsible party
So almost a quarter of the time, shippers had the wrong responsible party on their late delvieries before going through the ISO workflow in 2023. That’s a lot of bad data feeding the routing guides for 2024!
ISO Award Winners 2023
As we look ahead to brighter days in freight, we want to also acknowledge the best of the best carriers in the ISO network. These carriers delivered exceptional service levels for their ISO shippers despite a very difficult environment in 2023.
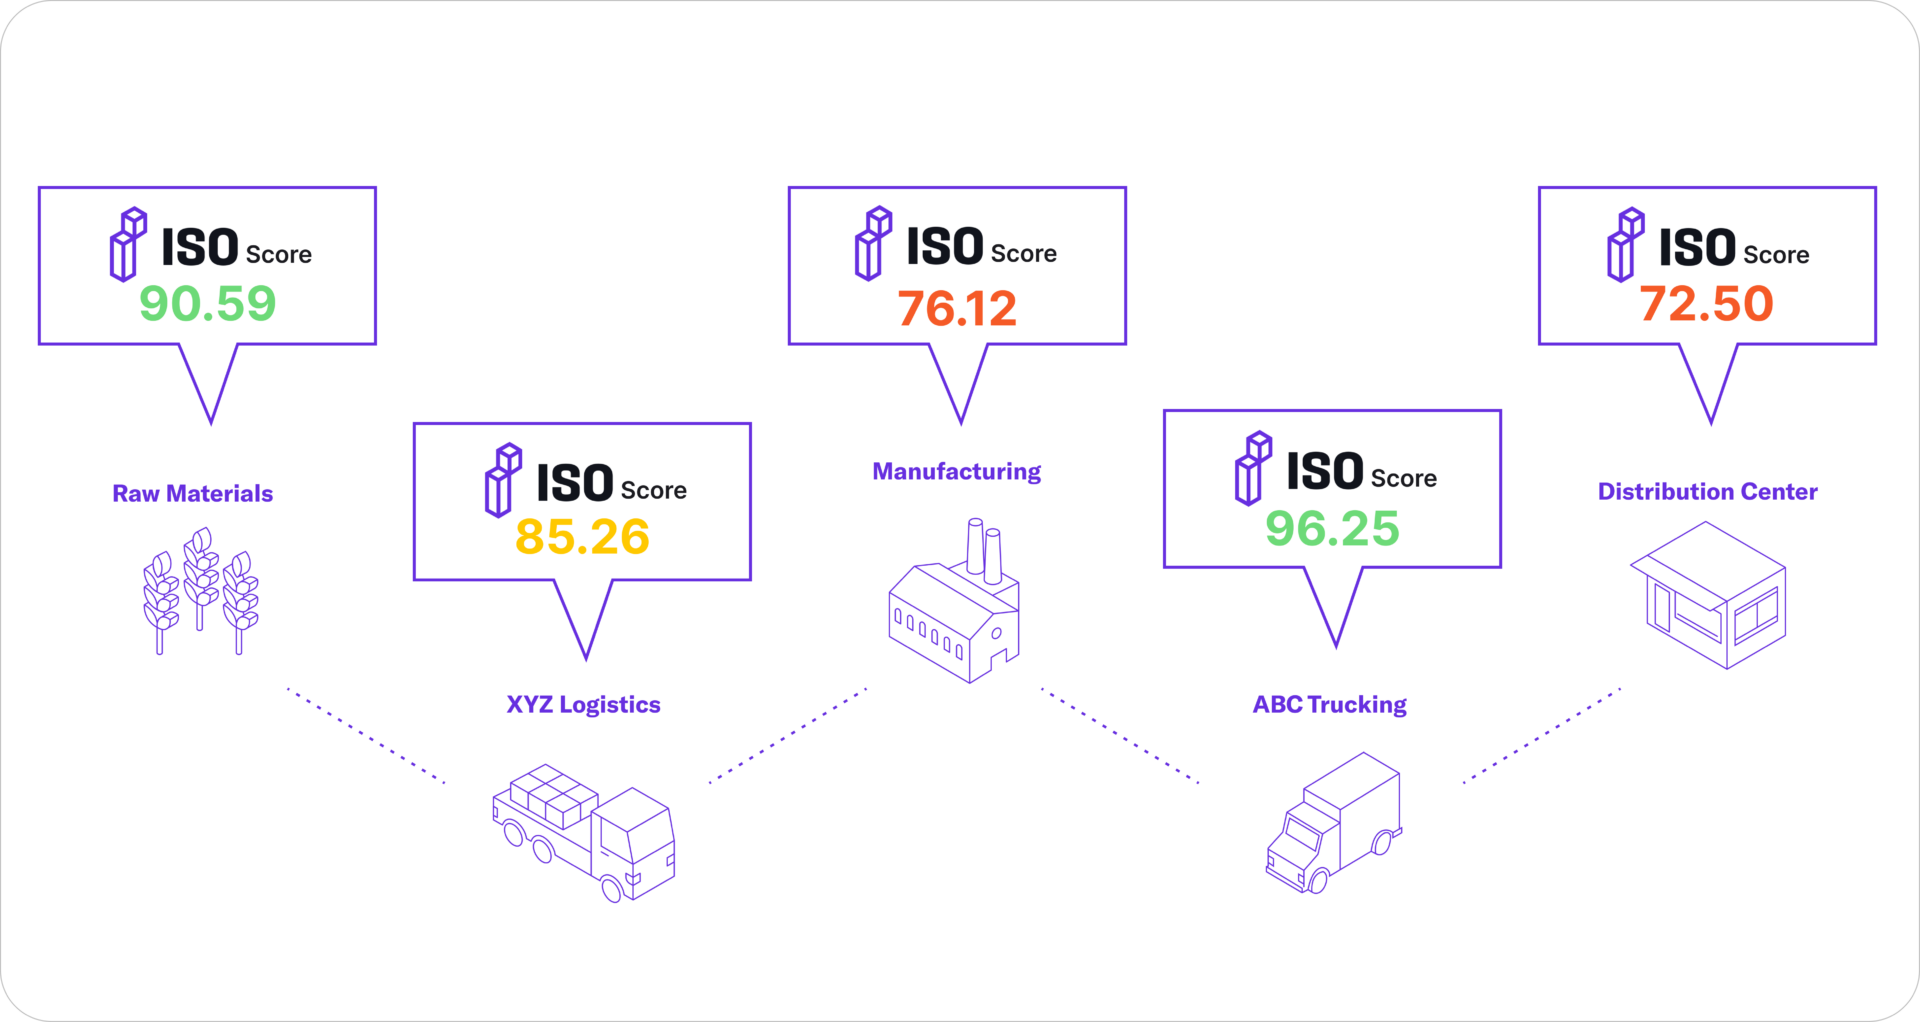
How we chose our winners
Our winners are selected based on their ISO Score. Think of the ISO Score as a composite service-level performance metric, like a “FICO” score for transportation reliability and trust. Much like a credit score, the ISO score pulls from a number of different performance factors and metrics, namely Tender Acceptance, On-Time Delivery, and On-Time Pickup.
We see the ISO Score as the future of industry-wide performance measurement and benchmarking, and you can read more about that vision in Freightwaves. All parties, from retailers to manufacturers to their suppliers, benefit when we have a standard, transparent way to evaluate performance and the resulting costs of service of our partnerships and supply chains. It’s an evolving metric, so we’d love thoughts, questions and feedback on the ISO Score!
For more information on our award and category winner methodology, visit our FAQ page here.
ISO ‘Excellence in Service’ Awards Top 50:

Based on overall exemplary service levels across the entire network of ISO shippers, based on ISO score. Our top 50 is listed in alphabetical order:
- Amazon Freight
- American National Logistics
- Arrive Logistics
- Ascend Transportation
- Aspirations Inc.
- Booker Transportation Services
- C.H. Robinson
- Coyote Logistics
- Crowley
- CRST
- Direct Transport
- DLR Freight
- DSV
- Echo Global Logistics
- ECM Transport
- Edge Logistics
- Exxact Express
- Fetch Freight
- Flock Freight
- Fuze Logistics
- Glen Raven Logistics
- GlobalTranz
- Integrated Connection
- J.B. Hunt
- KBX
- Keller Freight Solutions
- Legacy Supply Chain
- Legend Transportation
- Market Express
- MoLo Solutions
- MX Solutions
- Navajo Express
- Pepsi Logistics Company
- Quickway Logistics
- R.H. Crawford
- R2 Logistics
- Ryan Transportation Service
- Sage Freight
- Spot
- St. James Transports
- Stord
- Tanager Logistics
- Taylor Brokerage
- Total Quality Logistics
- Traffic Tech
- Transfix
- Uber Freight
- Universal Capacity Solutions
- WEL Companies
- Woody Bogler Trucking Company
Congratulations to our 2023 ISO Award Winners! Here’s to an even stronger 2024! 💪
“Best Carrier” Category Winners
Apart from being more granular and transparent with our network, methodology and process, we also took a look at different categories for which we could identify top performers. Please note, our category winners are not necessarily “Top 50 ISO Award Winners”, but did all demonstrate exceptional service levels in these areas:
Top Performers by Region:
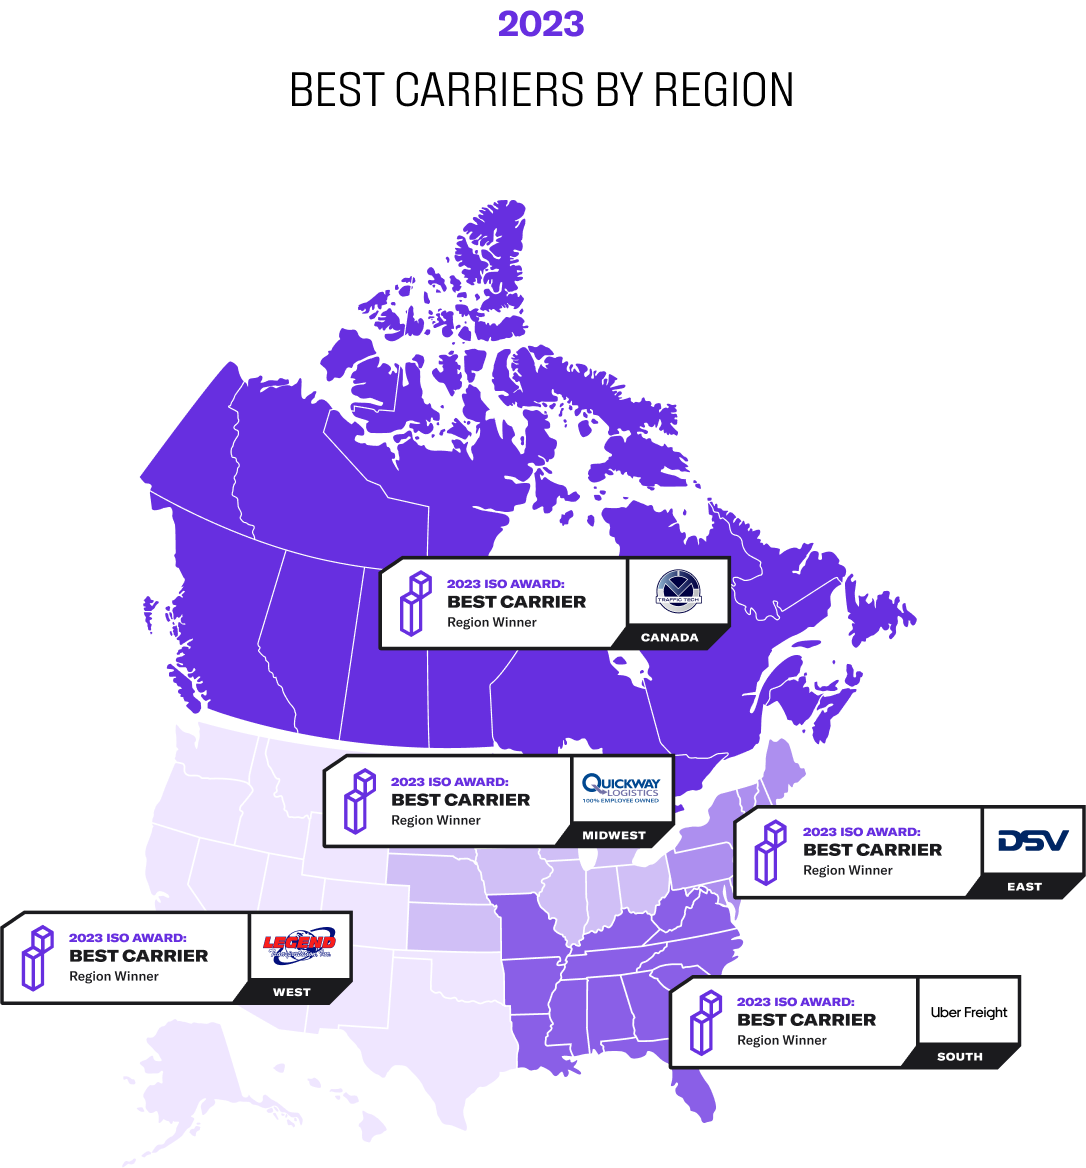
- East: DSV
- South: Uber Freight
- Midwest: Quickway Logistics
- West: Legend Transportation
- Canada: Traffic Tech
Top Performers by Mileage Band:
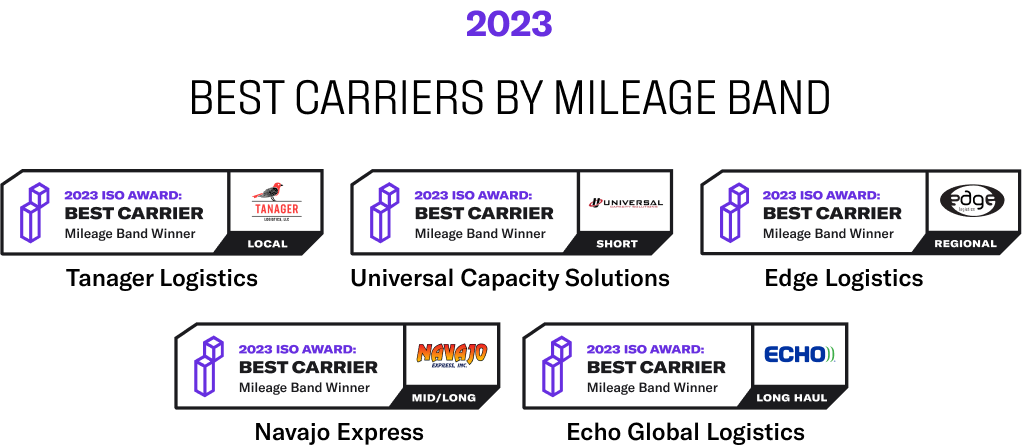
- Local (0-50): Tanager Logistics
- Short (51-150): Universal Logistics
- Regional (151-500): Edge Logistics
- Mid/Long (501-1000): Navajo Express
- Long Haul (1001+): Echo Global Logistics
Honorable Mention – Convoy
![]()
It is hard to think back on the year in freight without the rise and fall of Convoy coming to mind. So, we’d be remiss not to mention that the disruptive digital brokerage would have also been an ISO Award winner for 2023.
Known for aggressive pricing and vast capacity, Convoy’s routinely excellent service levels for shippers often went overlooked. Here’s a tip of the cap to the hard-working employees and technology that will continue to move our industry forward long after Convoy officially closes its doors.
Closing – thoughts on the year ahead
Looking ahead to 2024, most industry experts anticipate an upward trend in freight toward the latter half of the year. As capacity leaves the market and prices rise, the brokers and carriers that can demonstrate their exceptional performance and reliability will continue to get first crack at freight.
In 2024, we predict that measuring carrier reliability will replace fraud and double-brokering in terms of priority for the logistics world. It goes far beyond maintaining a solid reputation. Unreliable carriers have a major impact on cost-per-load, margins, revenue and the sustainability of your business.
This is the year that suppliers commit to being able to measure how service levels impact their bottom line, and begin to use that data to power their carrier selection and onboarding processes.
The Performance Standards Consortium
As an extension of this prediction, we’re seeing momentum build in the industry to actually standardize the way we collectively measure service performance. This is a critical step in the process to drive trust and transparency, and have universal tools to evaluate our supply chain partners.
Visionary brokerages and carriers are already coming together to establish the standard KPIs and processes the industry will use to benchmark carrier performance. Much like the scheduling standards consortium formed in 2022, a service data consortium will follow suit in 2024.